Auditing Patient Leakage, Cross-Platform Reproducibility, and Basal-Squamous Plasticity in Pancreatic Ductal Adenocarcinoma: A Multi-Cohort NCBI GEO Doctoral Synthesis
Background: Pancreatic ductal adenocarcinoma (PDAC) carries a five-year relative survival of approximately 13% alongside steadily rising global incidence [1,2]. Despite 1,791 public human PDAC series in the NCBI Gene Expression Omnibus (GEO), automated browser workflows such as default GEO2R and secondary multi-cohort meta-analyses routinely yield irreproducible signatures due to unlogged intensity matrices, duplicate array inflation, uncalibrated two-channel baselines, spreadsheet metadata drift, and unrecognized patient reuse across array and RNA-sequencing deposits [7,8,9,13,18].
Methods: We surveyed global human PDAC GEO deposition (2006 to 2026; 1,791 total series, 143 curated cohorts) and performed an end-to-end methodological audit across six primary clinical series spanning Affymetrix (GPL6244, GPL570), Agilent two-channel (GPL20769), custom microarray (GPL15048), and Illumina RNA-sequencing (GPL24676; N = 1,038 raw profiles, N = 769 strictly non-overlapping specimens). Fixing Discovery GSE183795 (N = 244; 134 tumors with survival) without peeking into external cohorts, we constructed an L2-regularized 10-gene diagnostic classifier and a frozen 10-gene Cox prognostic model (penalizer = 0.25), then evaluated blind cross-platform diagnosis with Decision Curve Analysis [21], Bland-Altman cross-technology agreement, leakage-titration Monte Carlo bias curves, Leave-One-Cohort-Out (LOCO) survival generalization (N = 230 pooled external patients, 161 deaths), and site-matched organ metastasis decontamination.
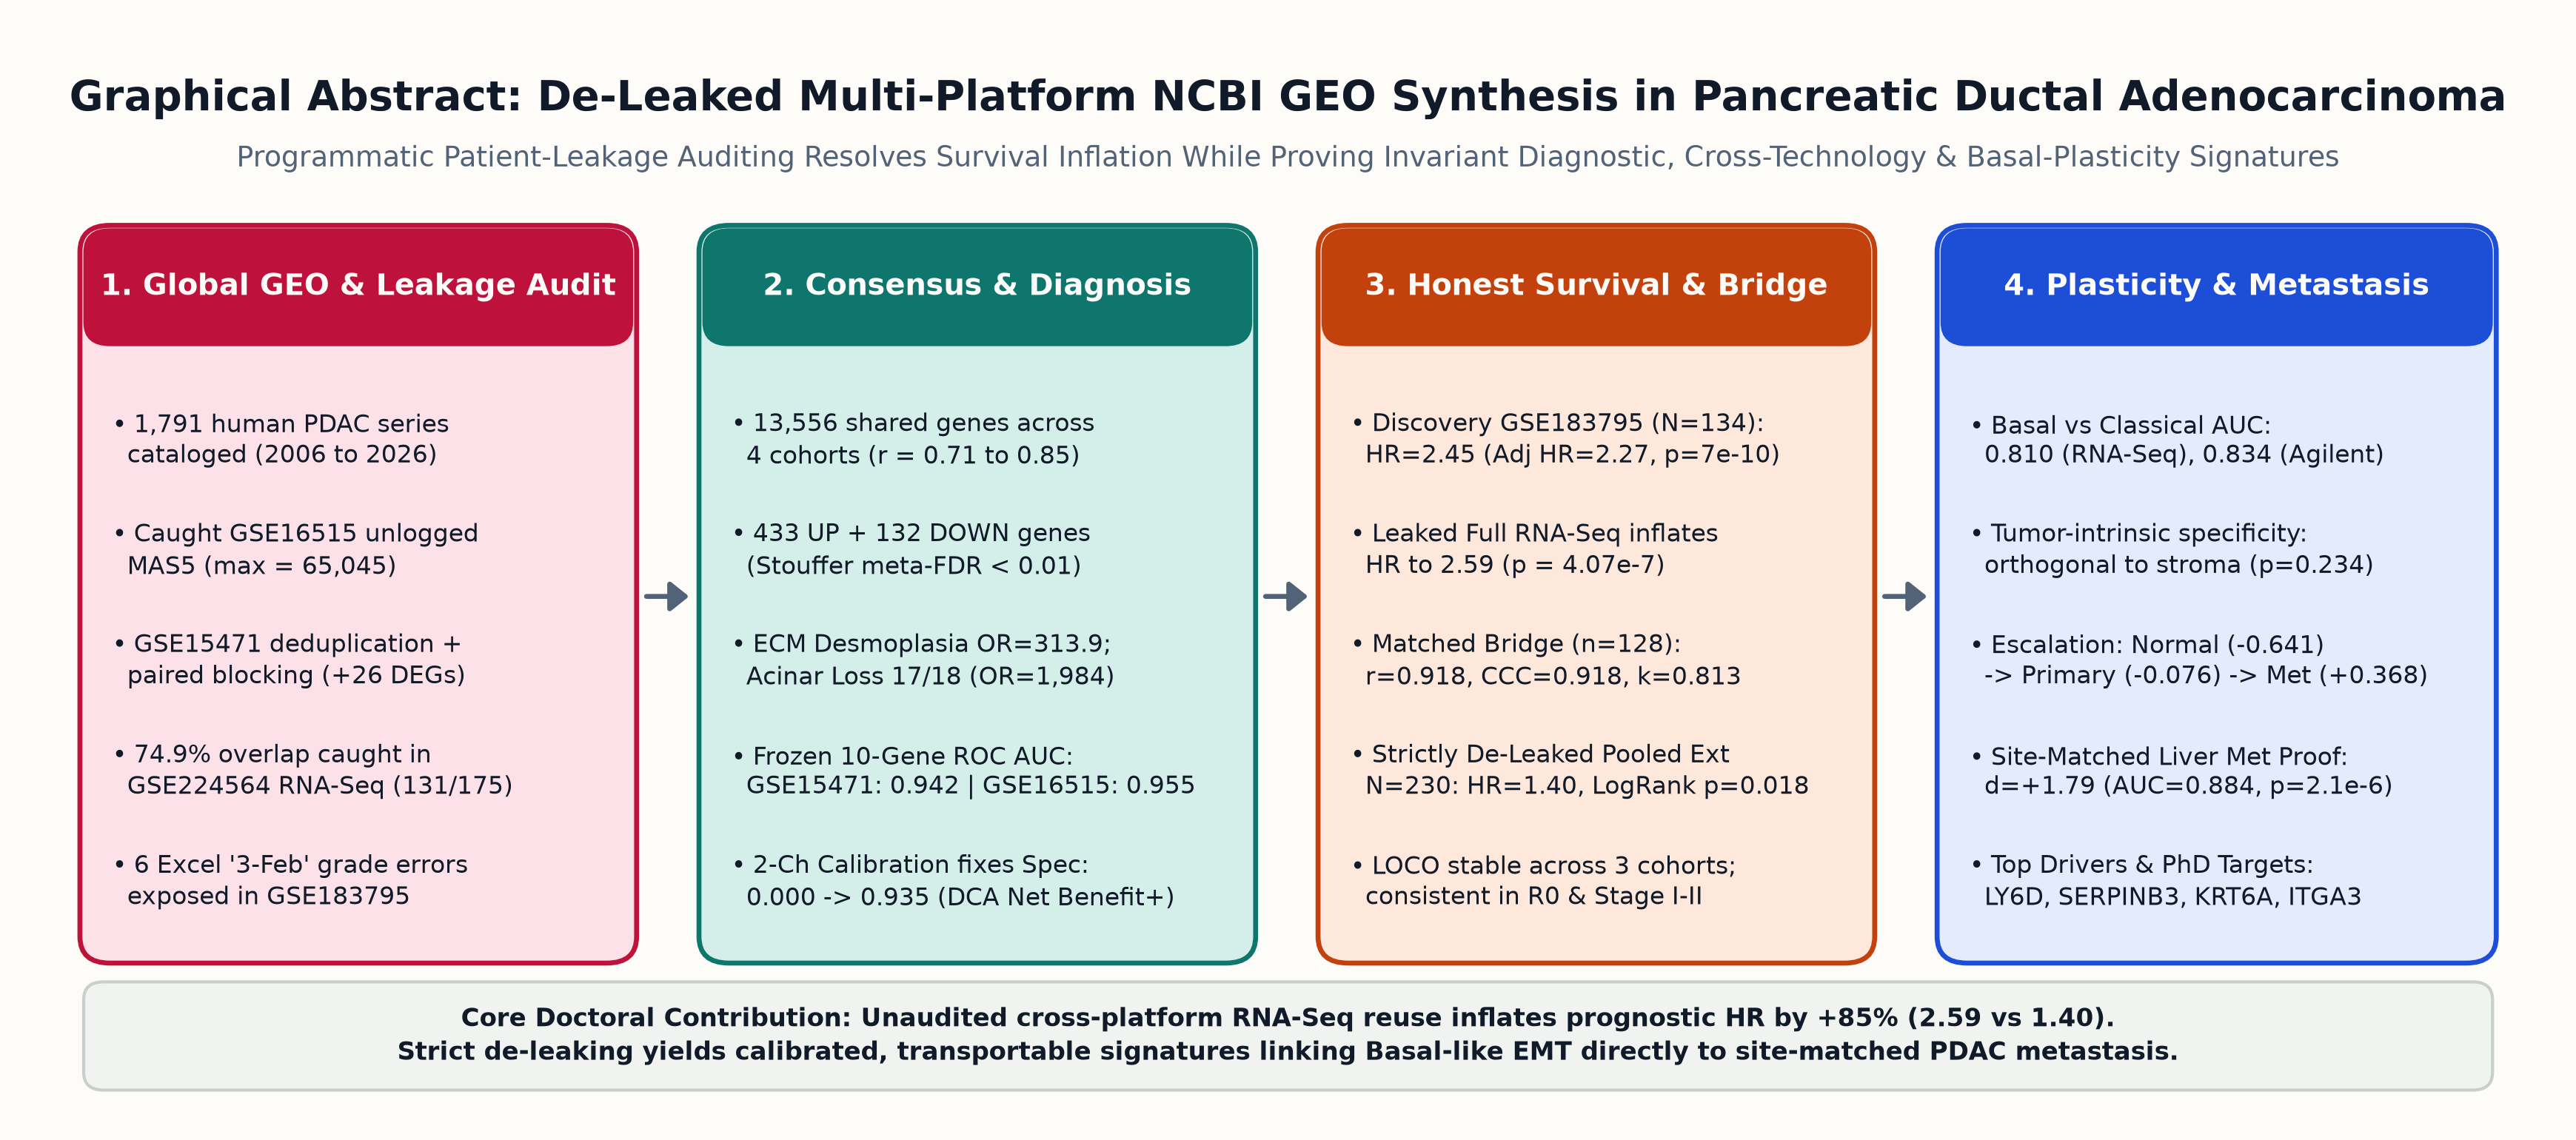
Results: Programmatic intersection revealed pervasive cross-study patient overlap: GSE62452 (90/130 arrays matching all 45 patient E-IDs) and GSE28735 (45 pairs) are subsumed within GSE183795, while 131 of 175 bulk RNA-seq tumors (74.9%) in GSE224564 reuse the exact German-1/2/3 and UMD-1 discovery patients, leaving only 44 independent UMD-2/3 RNA-seq tumors. Auditing also rescued unlogged MAS5 intensities in GSE16515 (maximum 65,045), merged replicated paired arrays in GSE15471 (+26 empirical Bayes DEGs recovered via paired blocking), and flagged six Excel date-corrupted grading entries ('3-Feb') inside GSE183795. Across 13,556 shared genes (r = 0.709 to 0.847), weighted Stouffer integration isolated 433 upregulated and 132 downregulated consensus markers pairing extreme extracellular matrix desmoplasia (29/32 genes, OR = 313.9) with near-total exocrine acinar loss (17/18 genes, OR = 1,984.3). Frozen 10-gene diagnostic discrimination transferred onto blind external cohorts with ROC AUCs of 0.9421 (GSE15471), 0.9549 (GSE16515), and 0.8883 (GSE71729), while intercept recalibration eliminated Agilent baseline offset (specificity 0.000 to 0.935, Brier 0.170 to 0.119) and produced positive net clinical benefit. On prognostic survival, naive evaluation of unaudited GSE224564 inflated the hazard ratio by 85% (HR = 2.591, p = 4.07e-7 vs HR = 1.370 at 0% overlap in Monte Carlo titration), even as 128 matched patients verified high microarray-to-RNA-seq fidelity (r = 0.9180, Lin's CCC = 0.9178, Cohen's kappa = 0.8125). Restricting validation strictly to 230 de-leaked external patients confirmed significant generalization (median OS 16.17 vs 22.00 months, Log-Rank p = 0.0184, Stratified HR = 1.396, 95% CI 1.019 to 1.913, p = 0.0378). Independently, the locked risk score classified Basal-like vs Classical PDAC (AUC 0.8096 RNA-seq; 0.8341 Agilent; SERPINB3-High Cohen's d = +0.941) without stromal bias (p = 0.234) and separated liver PDAC metastases from site-matched normal liver parenchyma (Cohen's d = +1.787, AUC = 0.8844, p = 2.10e-6).
Conclusions: Enforcing programmatic identity auditing, paired blocking, and threshold recalibration prevents spurious multi-cohort biomarker overfitting, separates realistic out-of-sample prognostic generalization (HR = 1.40) from leakage artifacts (HR = 2.59), and establishes a translational bridge linking epithelial mitotic-vesicular proliferation and ITGA3-anchored Basal plasticity directly to hepatic metastasis.
2. Materials and Methods
2.1 Global NCBI GEO Cataloging and Primary Cohort Acquisition
Systematic discovery of human pancreatic cancer transcriptomic deposits was executed through NCBI E-utilities (esearch and esummary, db=gds) targeting Homo sapiens GEO Series (gse) between January 2006 and November 2026 matching pancreatic cancer or pancreatic ductal adenocarcinoma search descriptors. Global search returned 1,791 unique series (1,108 carrying explicit pancreatic cancer terms in the series title), from which clinical, platform, technology, and publication-date metadata were compiled for the 143 largest and clinically richest unique series (data/processed/geo_pdac_catalog_master.csv).
Expression series matrices, soft-family archives, and official Affymetrix platform annotation files (GPL6244.annot.gz and GPL570.annot.gz) were downloaded directly from sanctioned NCBI FTP mirrors (ftp.ncbi.nlm.nih.gov/geo/). Two-channel Agilent profiles (GSE71729, GPL20769) used universal human reference RNA in Channel 1 and patient specimen Channel 2 RNA, with tissue source labels (Pancreas_Primary, Pancreas_Normal, Liver_Metastasis, Liver_Normal, Lung_Metastasis, Lung_Normal, LymphNode_Metastasis, LymphNode_Normal, Peritoneal_Metastasis, CellLine), Moffitt tumor subtype (1 = Classical, 2 = Basal), stromal subtype (1 = Low, 2 = Normal, 3 = Activated), and overall survival parsed programmatically from Channel 2 attributes [4]. Custom Affymetrix GPL15048 expression data and 41,024 gene mappings for GSE57495 were extracted directly from GSE57495_family.soft.gz [12], while bulk RNA-sequencing log-normalized counts (20,080 genes across 175 tumors) for GSE224564 were joined 1:1 with clinical stage, histologic grade, cohort site, SERPINB3 binary status, molecular subtype, cancer death status, and follow-up duration [13].
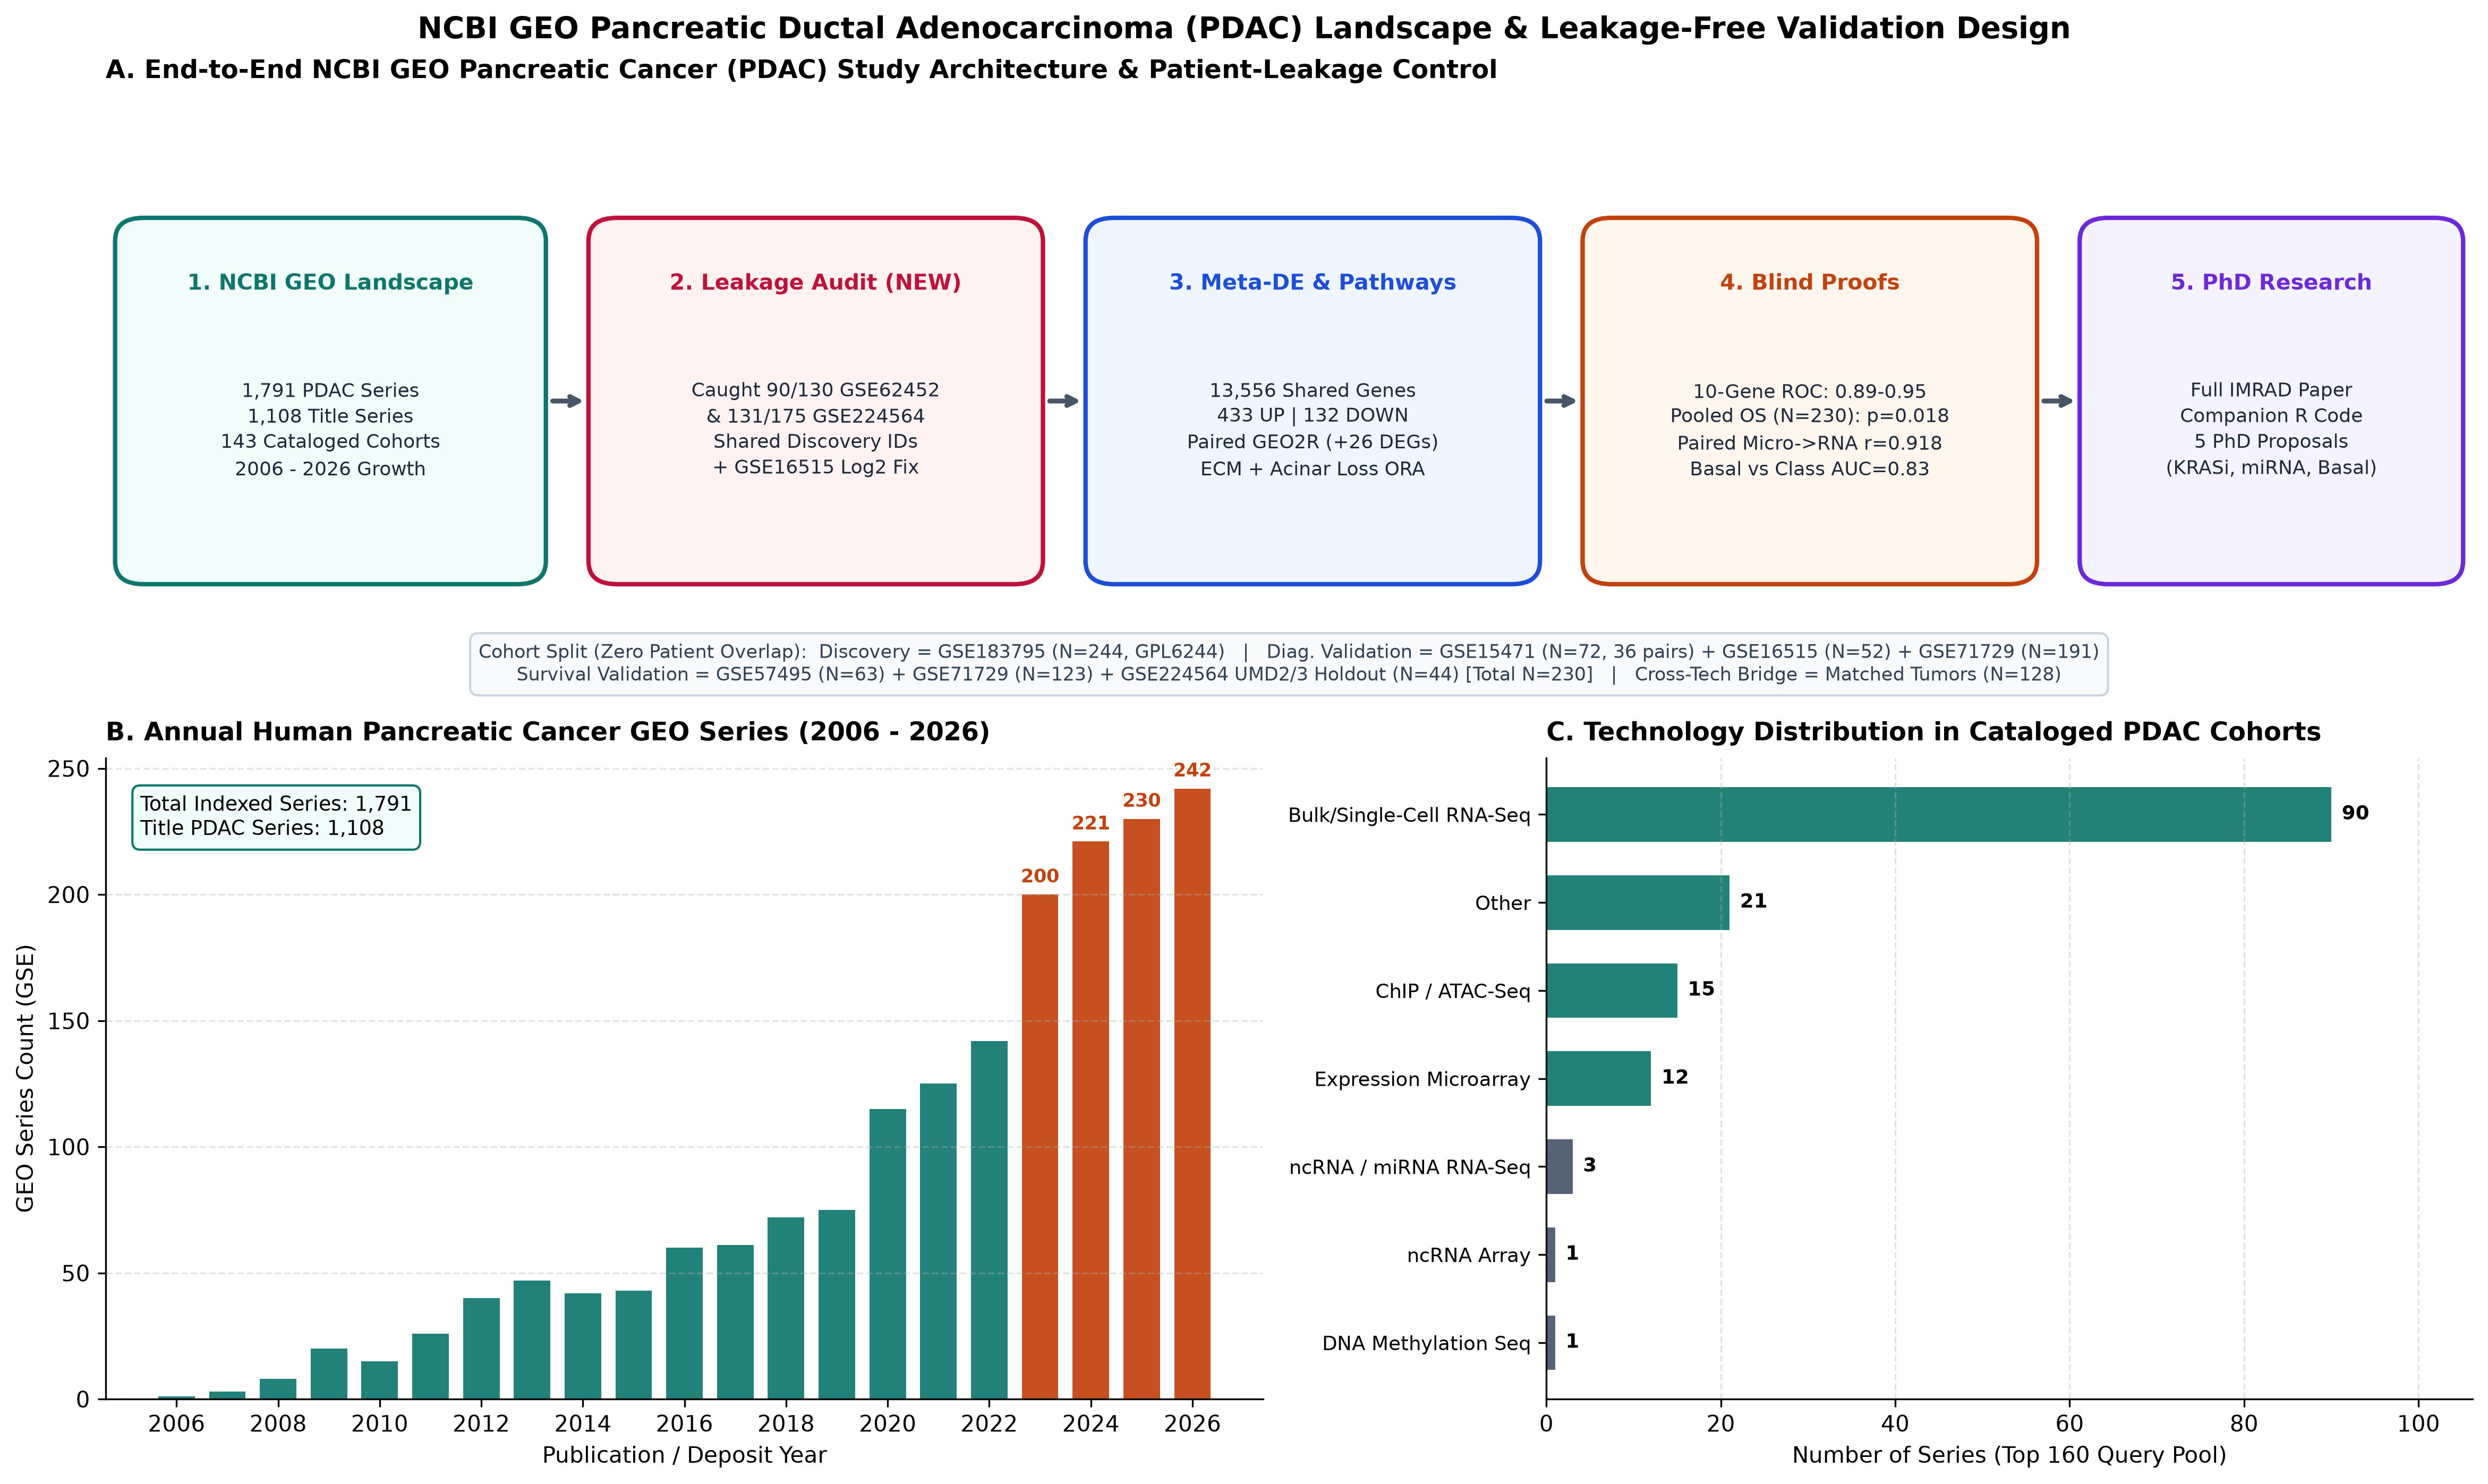
GSE183795) from blind diagnostic, cross-platform, and de-leaked external survival arms. Panel B shows annual human PDAC GEO series submissions across 1,791 series, highlighting rapid expansion from 2023 (200) through 2026 (242). Panel C details assay modality distributions dominated by high-throughput RNA sequencing across top curated series.2.2 Code Audit of Default NCBI GEO2R and Multi-Cohort Quality Controls
Static inspection and execution benchmarking of NCBI GEO2R's default GEOquery plus limma pipeline [14,15,16] across pancreatic cohorts uncovered four recurring methodological defects that compromise multi-cohort inference, all of which were rectified in our companion R implementation (src/geo2r_upgraded_pdac.R) and primary Python pipeline (src/02_eda_de_meta_analysis.py). First, GSE16515 distributions exhibited linear MAS5 intensities reaching 65,045.0 (median = 18.17, q99 = 3,283.2) rather than log2-transformed values (13.11 to 15.06 across comparison arrays); automatic trigger max > 100 or q99 > 50 applied a corrective $\log_2(x + 1)$ stabilization prior to statistical testing. Second, default probe-level modeling across 54,675 rows in GPL570 multiplies hypothesis tests and creates discordant probe directions per gene; we purged ambiguous multi-mapped (///) probes and collapsed duplicate HGNC gene symbols by maximum cross-sample interquartile range (IQR), preserving 20,052 genes in GPL6244, 42,904 in GPL570, and 41,024 in GPL15048.
Third, GSM inspection in GSE15471 (78 raw arrays) exposed 6 technical _rep re-hybridizations across three samples. Averaging each sample pair yielded 72 unique tissue specimens forming 36 complete matched Tumor-Normal pairs, enabling formal paired blocking (~ patient_id + group) rather than naive unpaired contrasts. Fourth, programmatic cross-cohort patient auditing intersected sample titles, normalized biological IDs, and transcriptome-wide sample-sample Pearson correlations across GSE183795, GSE62452, GSE28735, and GSE224564 before defining training and validation boundaries. Simultaneously, baseline clinical parsing exposed six survival records inside GSE183795 whose histological grade field carried '3-Feb', a canonical Microsoft Excel auto-formatting corruption of mixed grade notation '2-3' [18], which was rescued programmatically into the high-grade category for multivariable Cox modeling.
N = 1,038 Raw Arrays/RNA-Seq; N = 769 Unique Non-Overlapping Specimens).| Cohort & Platform | Audited Role | Samples (Comp.) | Surv N / Deaths (%) | Med OS / Rev-KM FU (mo) | AJCC Stage | Histologic Grade | Subtype Breakdown |
|---|---|---|---|---|---|---|---|
| GSE183795 (Affy GPL6244) | Discovery (DE, Diag CV, Cox Train) | 244 (139 Tumor / 105 Normal) | 134 / 86 (64.2%) | 14.33 / 27.60 | Stage 1-2: 112, Stage 3-4: 22 | G1-2:78, G3-4:55 (6 Excel '3-Feb'), GX:1 | Not reported |
| GSE15471 (Affy GPL570) | External Validation #1 (Paired DE & Diag) | 72 (36 Tumor / 36 Normal) | 0 (Diag) / Not reported | Not reported / Not reported | Not reported | Not reported | Not reported |
| GSE16515 (Affy GPL570) | External Validation #2 (Mayo Diag & MAS5 Fix) | 52 (36 Tumor / 16 Normal) | 0 (Diag) / Not reported | Not reported / Not reported | Not reported | Not reported | Not reported |
| GSE71729 (Agilent GPL20769) | External Validation #3 (Diag, Surv, Subtype, Met) | 357 (145 Tumor / 134 Normal / 61 Met / 17 Cell) | 123 / 83 (67.5%) | 17.00 / 35.00 | Not reported | Not reported | Cla:88, Bas:35 |
| GSE57495 (Custom GPL15048) | External Validation #4 (Surv Independent #1) | 63 (63 Primary Tumor) | 63 / 42 (66.7%) | 21.50 / 36.90 | Stage 1-2: 63, Stage 3-4: 0 | Not reported | Not reported |
| GSE224564 Full (Bulk RNA-Seq) | 74.9% Leaked NCI-UMD-German RNA-Seq | 175 (175 Primary Tumor) | 175 / 118 (67.4%) | 16.70 / 33.63 | Stage 1-2: 150, Stage 3-4: 24, Missing: 1 | G1-2:101, G3-4:71, GX:3 | Cla:95, Bas:48, Unc:32 |
| GSE224564 UMD-2/3 (RNA-Seq) | Zero-Leakage RNA-Seq Holdout #3 | 44 (44 Primary Tumor) | 44 / 36 (81.8%) | 21.00 / 35.23 | Stage 1-2: 43, Stage 3-4: 1 | G1-2:25, G3-4:17, GX:2 | Cla:26, Bas:11, Unc:7 |
GSE62452 (90/130 arrays matching 45/45 E-IDs) and GSE28735 (45 pairs) are excluded as overlapping subsets of GSE183795.3. Results
3.1 Unsupervised Tumor-Normal Separation, GEO2R Gains, and Leakage Detection
Prior to any supervised feature ranking or classifier fitting, unsupervised principal component analysis across the top 2,000 variable genes separated pancreatic tumors cleanly from non-malignant pancreas along the first principal component in all four diagnostic series (Figure 2A to 2D): GSE183795 accounted for 31.67% variance along PC1 (Welch $p = 8.41 \times 10^{-17}$), deduplicated GSE15471 explained 46.22% ($p = 3.01 \times 10^{-8}$), log-corrected GSE16515 explained 36.36% ($p = 9.71 \times 10^{-5}$), and two-channel GSE71729 explained 18.96% ($p = 1.77 \times 10^{-13}$). Applying patient-blocked empirical Bayes paired contrasts (Tumor - Normal within 36 deduplicated pairs) on GSE15471 recovered 1,584 significant DEGs at $\text{FDR} < 0.01$ and $|\log_2\text{FC}| \ge 1.0$, compared with 1,558 under an unpaired contrast (+26 recovered true transcriptional differences).
Systematic patient-identity auditing revealed extensive cross-deposit reuse across widely benchmarked NCI/UMD/German GEO cohorts (Figure 2E). In Affymetrix GPL6244, GSE62452 shared 90 of 130 arrays spanning all 45/45 patient E-identifiers inside GSE183795 (median best r = 0.944), and GSE28735 contained 45 earlier matched pairs from the identical surgical biobank (median best r = 0.990 against GSE62452), requiring immediate exclusion from validation. Even more consequential, intersection against the 2023 bulk RNA-seq dataset GSE224564 ($N = 175$) identified exact sample stem matches across all 43/43 German-1, 40/40 Germany-2, 28/28 Germany-3, and 20/20 UMD-1 tumors, exposing 131 of 175 (74.9%) RNA-seq tumors as overlapping Discovery patients from GSE183795 and isolating UMD-2 (n = 20) plus UMD-3 (n = 24) as the sole independent RNA-seq holdout (N = 44).
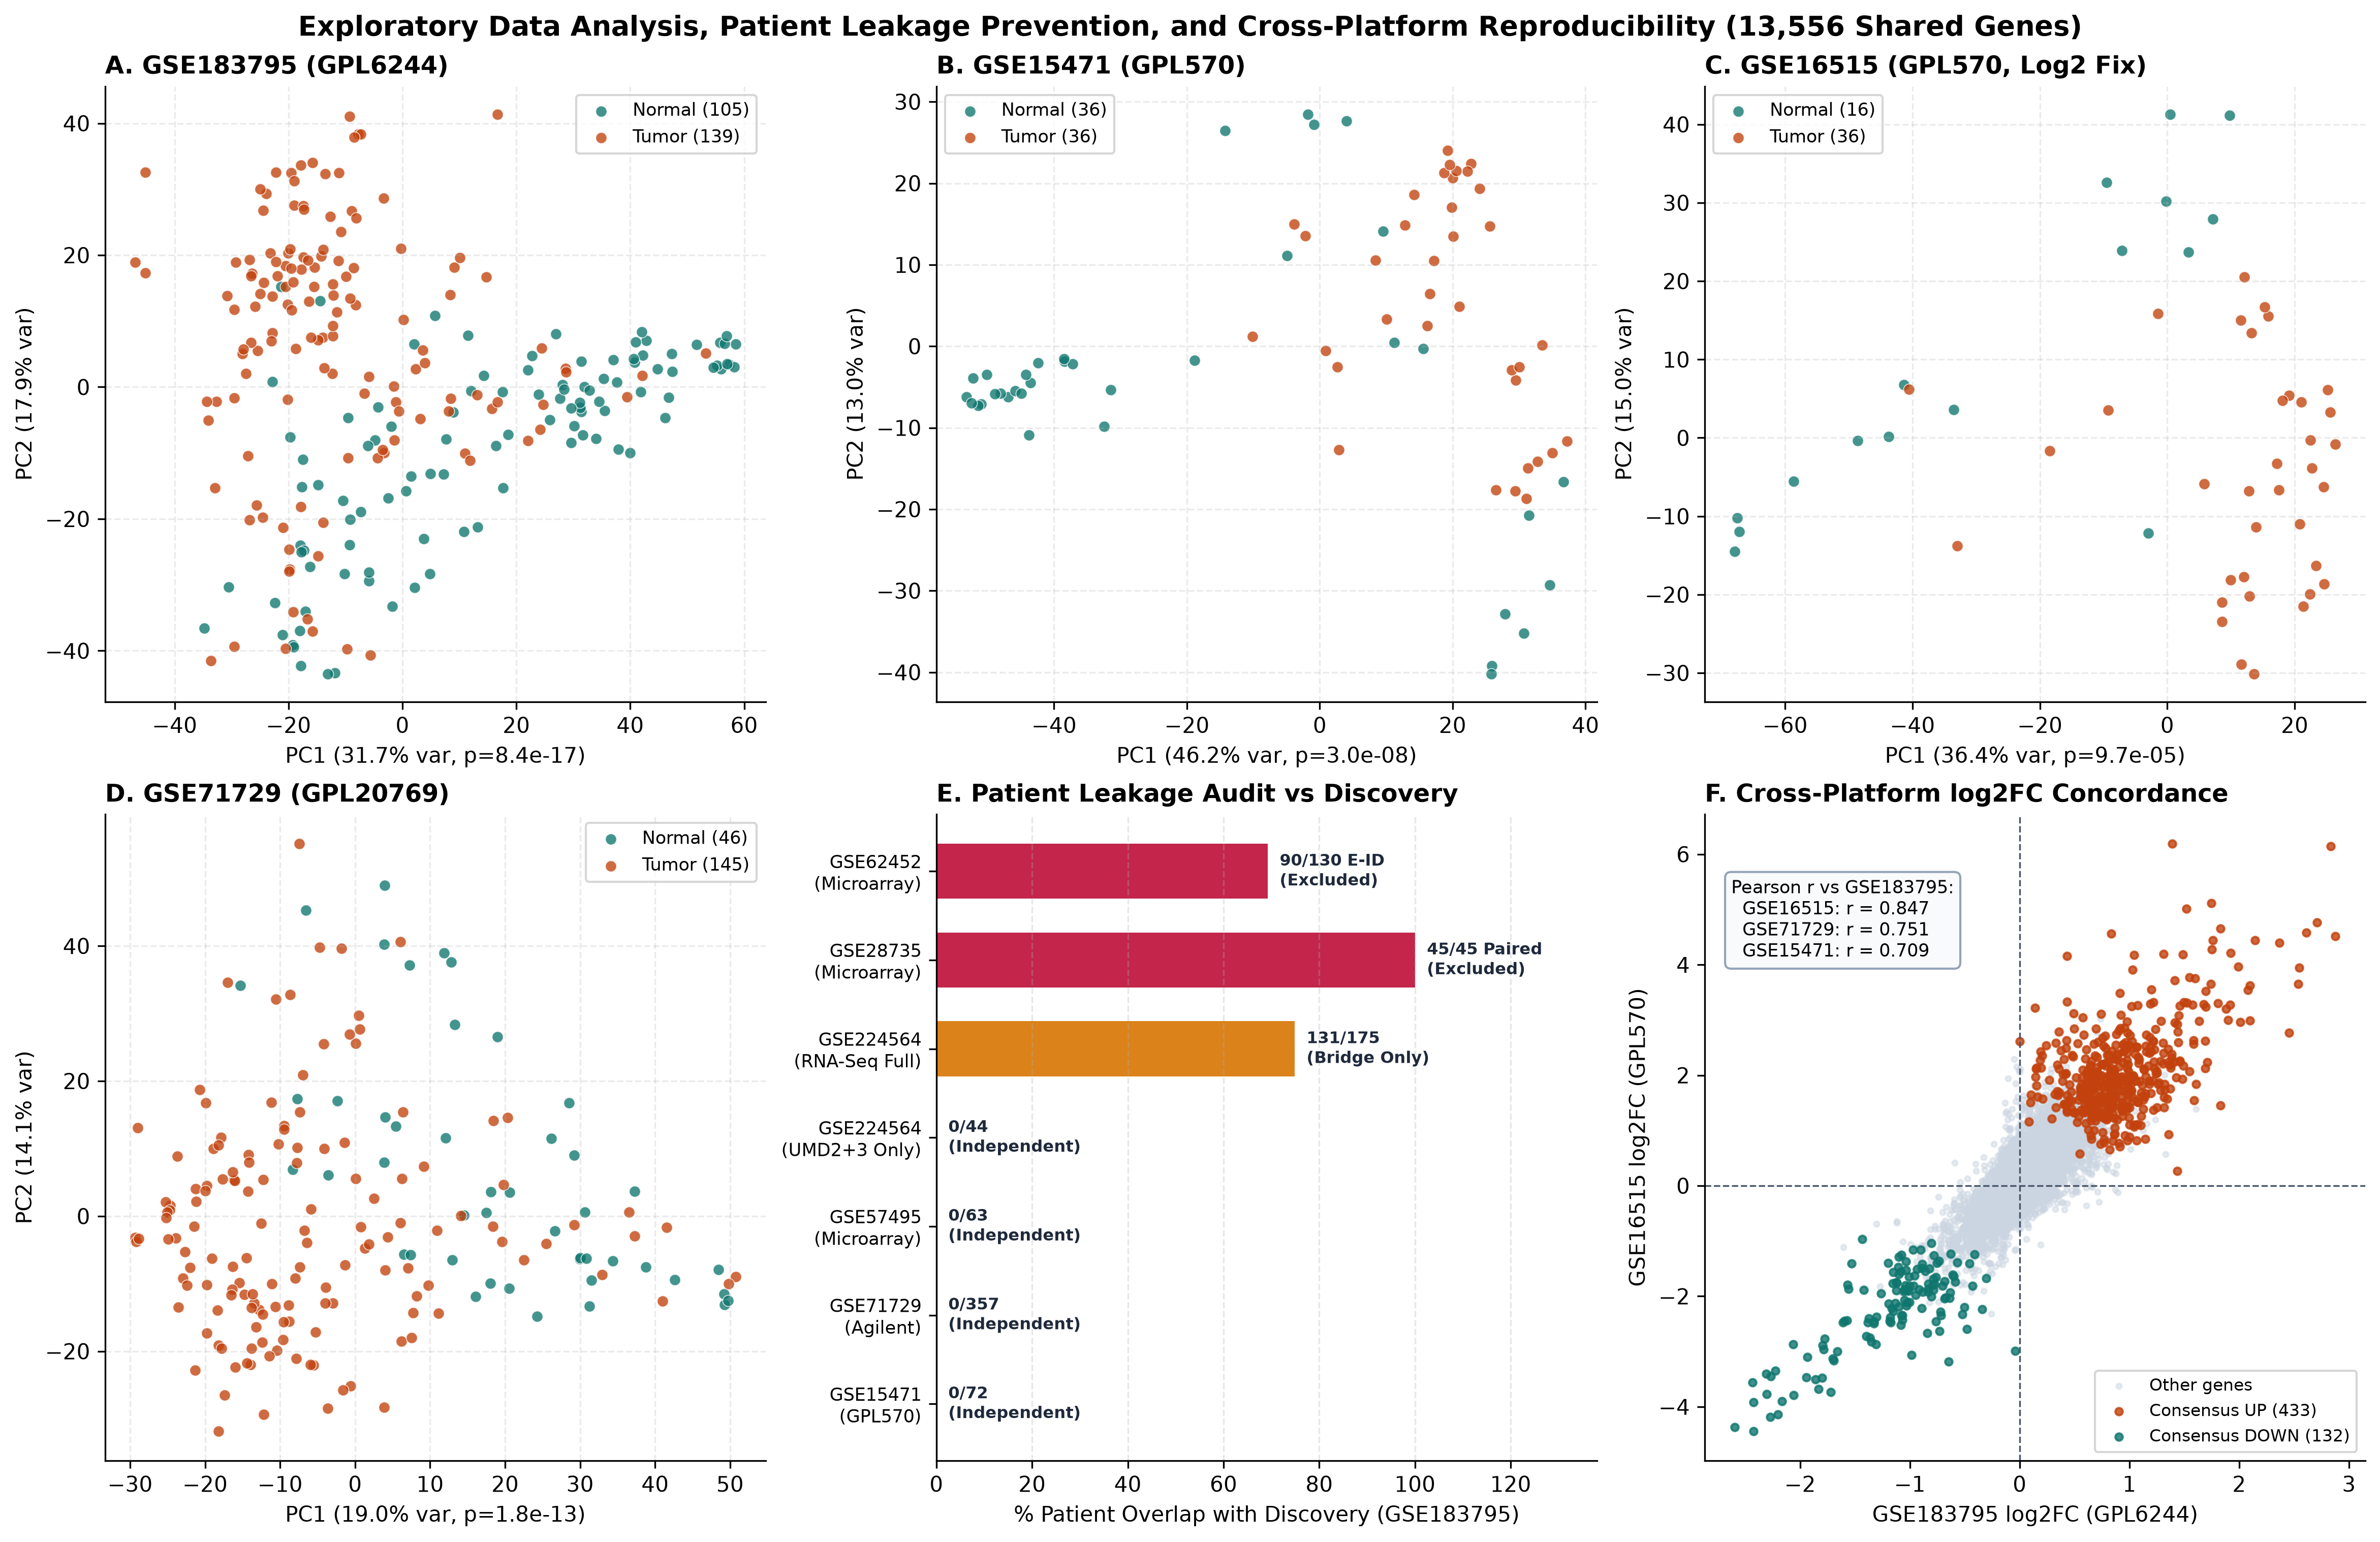
GPL6244, GPL570, GPL20769) following MAS5 log-scale correction (GSE16515) and _rep replicate collapsing (GSE15471). Panel E charts exact patient-identifier overlaps linking GSE62452, GSE28735, and 74.9% of GSE224564 back to GSE183795. Panel F confirms global $\log_2\text{FC}$ correlation across 13,556 shared genes.3.2 Cross-Platform Transcriptional Consensus and Dual Pathway Switch
Pairwise genome-wide effect-size vectors across the 13,556 shared genes displayed strong cross-platform agreement (Pearson r = 0.8466 with GSE16515, r = 0.7513 with GSE71729, and r = 0.7092 with GSE15471; Figure 2F), identifying 7,037 directionally consistent genes at meta-FDR < 0.01 and isolating 433 Consensus Upregulated plus 132 Consensus Downregulated high-effect PDAC markers at $|\text{mean }\log_2\text{FC}| \ge 1.0$ (Figure 3A to 3B). Prominent invariant upregulated genes centered on basement-membrane laminin-integrin adhesion (LAMC2 $Z = +17.48$, LAMB3 $+16.75$, ITGA2 $+16.55$), epithelial protease and junctional programs (TMPRSS4 $+16.76$, AHNAK2 $+16.42$, KRT19 $+16.31$, GPRC5A, S100P), metabolic transporters (SLC2A1, SLC6A14), and collagenous matrix deposition (COL10A1). Conversely, MYRIP, AOX1, EPHX2, LIFR, GAMT, PDK4, BTG2, and exocrine zymogens were uniformly suppressed across all four platforms.
Fisher's exact pathway enrichment confirmed a striking dual biological transformation characteristic of PDAC carcinogenesis (Table 2, Figure 3C). Consensus upregulated genes heavily concentrated within Extracellular Matrix Remodeling & Desmoplasia (29/32 measured pathway genes, OR = 313.9, FDR = $1.06 \times 10^{-39}$) and EMT & Basal-Squamous Plasticity (23/32, OR = 81.7, FDR = $2.25 \times 10^{-27}$), followed by Mitotic Cell Cycle Progression (10/29, OR = 16.3, FDR = $4.06 \times 10^{-8}$), Tumor-Associated Macrophage Chemokine Niche (7/21, OR = 15.4, FDR = $7.14 \times 10^{-6}$), and Glycolysis/Hypoxia Metabolism (4/15, OR = 11.1, FDR = $2.47 \times 10^{-3}$). Simultaneously, Consensus downregulated transcripts collapsed almost the entire Pancreatic Exocrine Acinar Identity module (17/18 measured genes including PRSS3, CPA1, CPA2, CPB1, CTRC, CEL, PNLIPRP1, REG1A/B, REG3A/G, AQP8, GP2; OR = 1,984.3, FDR = $2.74 \times 10^{-33}$).
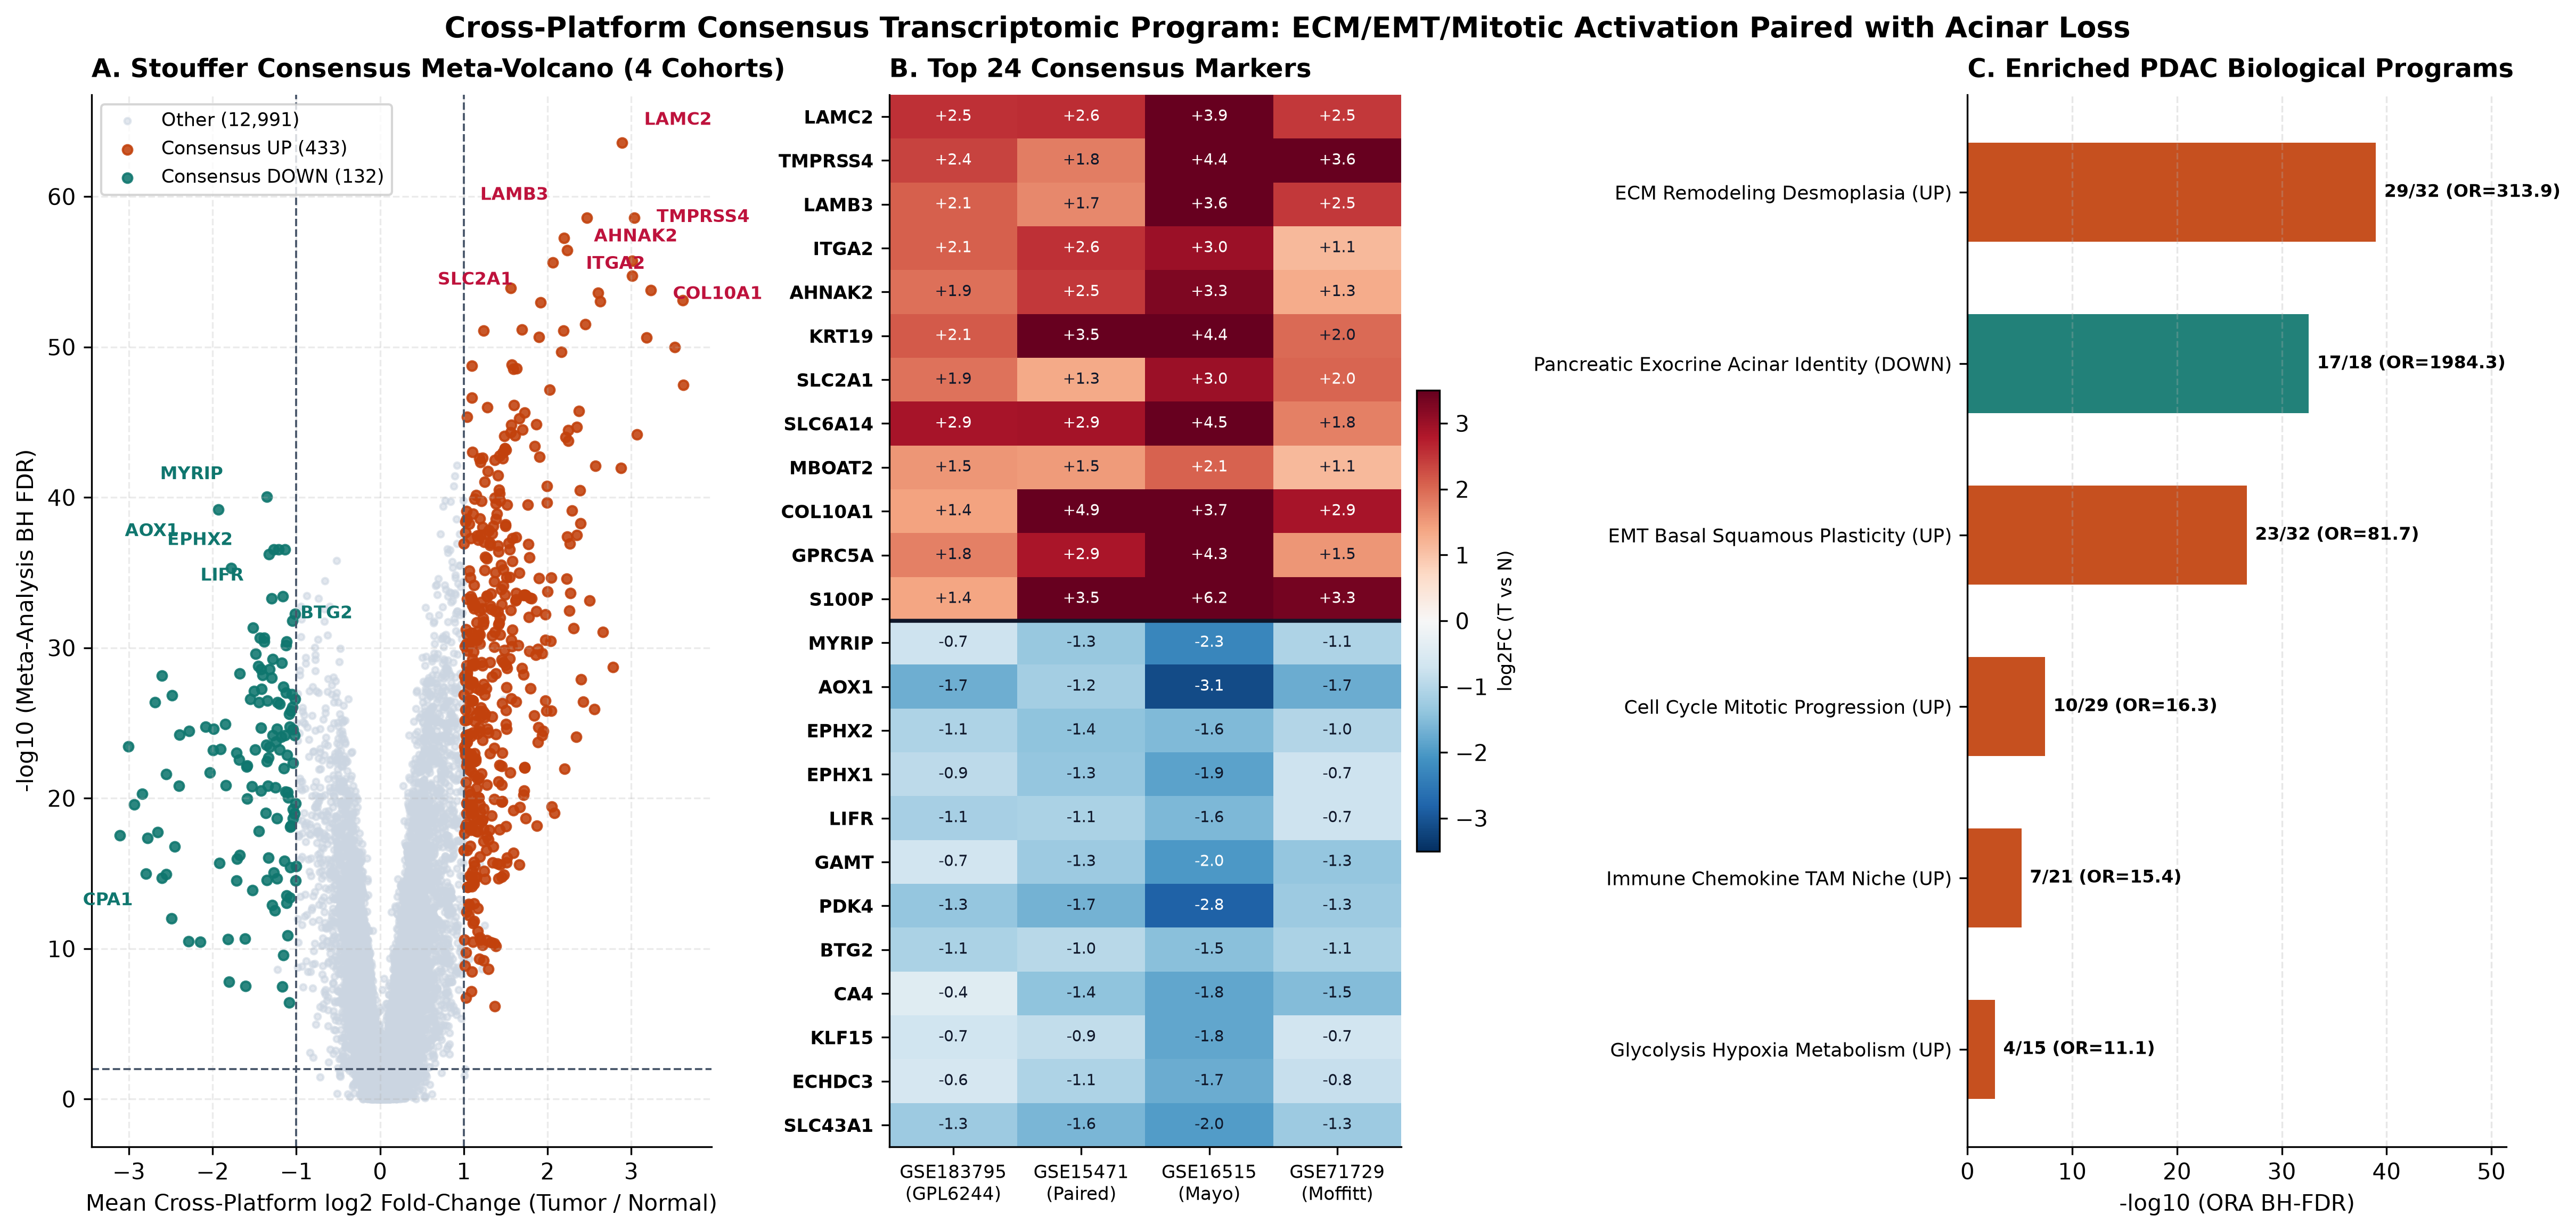
433 upregulated in orange/teal, 132 downregulated in crimson). Panel B summarizes cohort-by-cohort $\log_2\text{FC}$ consistency across leading consensus genes. Panel C ranks Fisher's Exact enrichment odds ratios across upregulated desmoplastic/EMT/mitotic programs versus collapsed exocrine acinar homeostasis.13,556-Gene Background Universe; FDR < 0.05 Shown).| Direction | Canonical Biological Module | Overlap (k / M) |
Odds Ratio | BH-FDR | Representative Consensus Genes |
|---|---|---|---|---|---|
| UP | ECM Remodeling Desmoplasia | 29 / 32 | 313.9 | 1.06e-39 | BGN, COL10A1, COL11A1, COL12A1, COL1A1, COL3A1, COL5A1, COL5A2 |
| DOWN | Pancreatic Exocrine Acinar Identity | 17 / 18 | 1984.3 | 2.74e-33 | AQP8, CEL, CLPS, CPA1, CPA2, CPB1, CTRC, GP2 |
| UP | EMT Basal Squamous Plasticity | 23 / 32 | 81.7 | 2.25e-27 | ANXA1, ANXA2, CDH3, CEACAM5, CEACAM6, FN1, ITGA3, KRT16 |
| UP | Cell Cycle Mitotic Progression | 10 / 29 | 16.3 | 4.06e-08 | BUB1, CCNB1, CENPF, ECT2, MAD2L1, MELK, NUSAP1, RRM2 |
| UP | Immune Chemokine TAM Niche | 7 / 21 | 15.4 | 7.14e-06 | CCL18, CCL20, CXCL10, CXCL14, CXCL5, IL1RN, PLAUR |
| UP | Glycolysis Hypoxia Metabolism | 4 / 15 | 11.1 | 2.47e-03 | ANLN, EGLN3, HK2, SLC2A1 |
GSE183795, GSE15471, GSE16515, and GSE71729. Remaining tested pairs (FDR >= 0.27) showed zero cross-direction enrichment.3.3 Proof A: Blind Cross-Platform Diagnostic Accuracy and Decision Curve Calibration
Selecting the top five upregulated (LAMC2 slope +0.6361, LAMB3 +0.1601, AHNAK2 +0.8641, TSPAN1 +0.1923, TMPRSS4 +0.2512) and five downregulated (BTG2 -0.2844, AOX1 +0.3305 after multivariate shrinkage, LIFR -0.1274, EPHX2 +0.0560, SLC7A2 -0.6789; intercept +0.9100) markers strictly inside GSE183795 achieved 5-fold CV ROC AUC = 0.8973 (95% CI 0.8604 to 0.9302, PR-AUC = 0.9293; Table 3, Figure 4). Applied strictly frozen with zero validation peeking, diagnostic discrimination not only generalized across unseen cohorts but strengthened across both external GPL570 studies: GSE15471 achieved ROC AUC = 0.9421 (0.8903 to 0.9807, PR-AUC = 0.9445) and GSE16515 achieved ROC AUC = 0.9549 (0.8869 to 1.0000, PR-AUC = 0.9827), while two-channel Agilent GSE71729 retained strong ranking accuracy at ROC AUC = 0.8883 (0.8404 to 0.9327, PR-AUC = 0.9667).
Comparing uncalibrated fixed probabilities ($p = 0.50$) against platform-calibrated thresholds exposed a critical cross-platform deployment trap (Figure 4B, Figure 7C). Because two-channel Agilent normalization shifted GSE71729 baseline predicted probabilities upward (mean predicted probability 0.9154 vs observed 75.92% tumor prevalence; logit shift $-1.5566$), fixed cutoff $p = 0.50$ produced 1.0000 sensitivity paired with complete specificity collapse (0.0000) and degraded Brier error (0.1703). Applying Youden $J$-optimization restored GSE71729 specificity to 0.9348 (Accuracy = 0.8063, Sensitivity = 0.7655) and increased GSE16515 accuracy from 0.8269 to 0.9423 (Sensitivity = 0.9444, Specificity = 0.9375). Formally, intercept recalibration reduced external Brier scores across every validation cohort (GSE15471: 0.1327 to 0.1080; GSE16515: 0.1023 to 0.0764; GSE71729: 0.1703 to 0.1194) and boosted clinical Decision Curve Net Benefit at $p_t = 0.50$ from 0.5183 to 0.5759 in GSE71729 and from 0.5192 to 0.5962 in GSE16515, cleanly outperforming both Treat-All and raw uncalibrated classification across clinically relevant decision thresholds (Figure 7C).
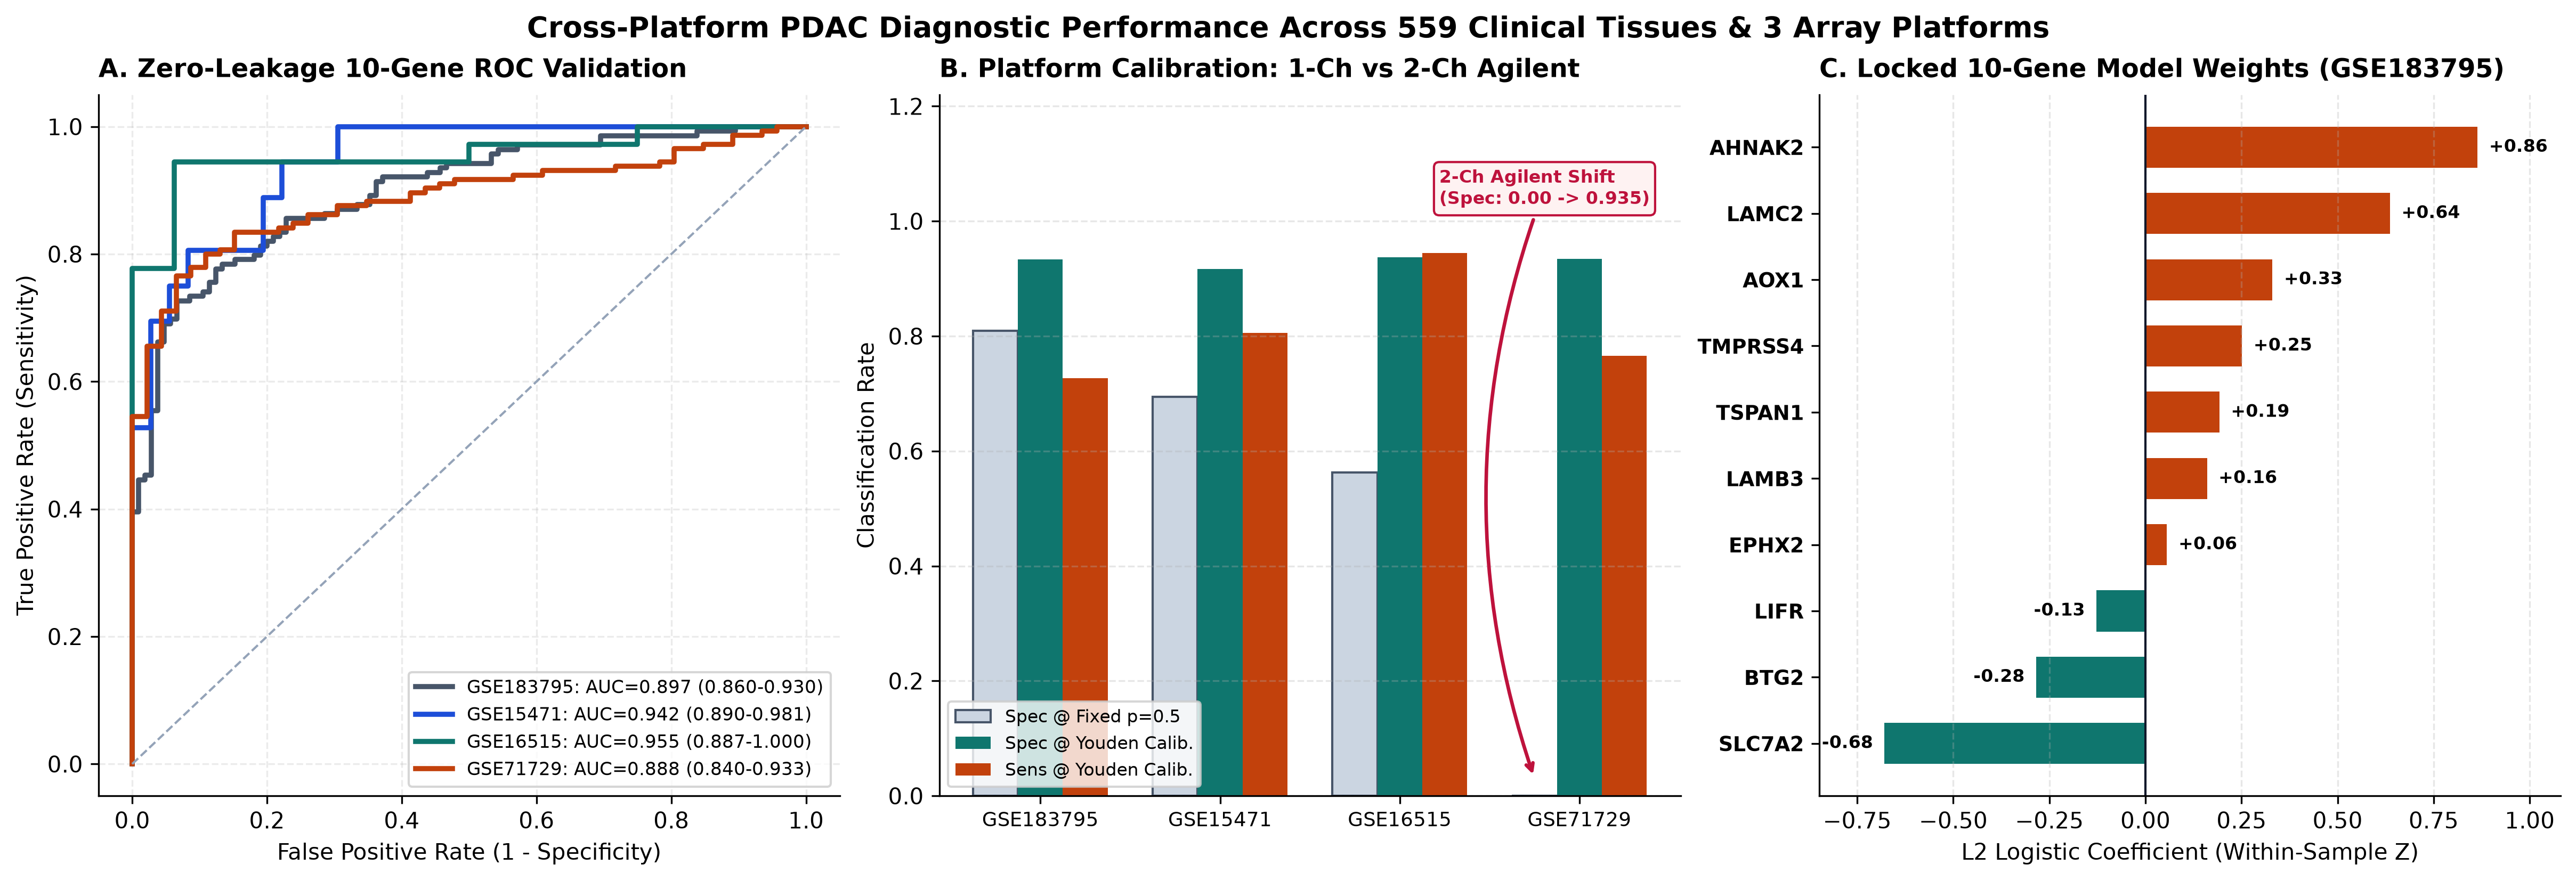
N = 559 Pancreatic Tissues). Panel A traces Discovery 5-fold CV and three strictly unseen external ROC curves spanning Affymetrix GPL6244, GPL570, and Agilent GPL20769 (AUCs 0.8883 to 0.9549). Panel B proves how fixed p = 0.50 fails in two-channel GSE71729 (Specificity 0.000) whereas Youden calibration restores 0.935 specificity. Panel C plots the frozen GSE183795 logistic coefficients.N = 559 Samples).| Cohort & Platform | N (T / N) | ROC AUC (95% Boot CI) | PR-AUC | Acc / Sens / Spec (p=0.5) | Youden Acc / Sens / Spec | Brier (Raw -> Cal) | NB @ p_t=0.5 (Raw -> Cal) |
|---|---|---|---|---|---|---|---|
| GSE183795 (Discovery 5-fold CV) | 244 (139T/105N) | 0.8973 (0.860-0.930) | 0.9293 | 0.811 / 0.813 / 0.809 | 0.816 / 0.727 / 0.933 | 0.128 -> 0.128 | 0.381 -> 0.377 |
| GSE15471 (External GPL570 Paired) | 72 (36T/36N) | 0.9421 (0.890-0.981) | 0.9445 | 0.819 / 0.944 / 0.694 | 0.861 / 0.806 / 0.917 | 0.133 -> 0.108 | 0.319 -> 0.347 |
| GSE16515 (External GPL570 Mayo) | 52 (36T/16N) | 0.9549 (0.887-1.000) | 0.9827 | 0.827 / 0.944 / 0.562 | 0.942 / 0.944 / 0.938 | 0.102 -> 0.076 | 0.519 -> 0.596 |
| GSE71729 (External GPL20769 Moffitt) | 191 (145T/46N) | 0.8883 (0.840-0.933) | 0.9667 | 0.759 / 1.000 / 0.000 | 0.806 / 0.765 / 0.935 | 0.170 -> 0.119 | 0.518 -> 0.576 |
p_cal applies only a single cohort-level intercept shift in log-odds space while retaining identical Discovery feature coefficients and ranking ROC AUC. NB: Net Benefit (Vickers & Elkin, 2006).3.4 Proof B: Cross-Technology Concordance (n = 128) and Leakage Inflation in Survival
Inside Discovery GSE183795 primary resected tumors ($N = 134$, $86$ deaths; median reverse-KM follow-up $27.60$ months), the regularized 10-gene Cox risk model (YKT6 $+0.2031$, CDKN3 $+0.1196$, NCAPD2 $+0.0906$, PRC1 $+0.0650$, WDHD1 $+0.0524$, PLXNA1 $+0.0311$, TPX2 $-0.0335$, ALDH1A1 $-0.1966$, HLF $-0.1307$, NR3C2 $-0.0711$) separated overall survival more than two-fold (median OS 11.60 vs 25.25 months, Log-Rank $p = 8.04 \times 10^{-5}$, binary HR = 2.448, 95% CI 1.548 to 3.870, C-index = 0.6786; Table 4, Figure 5A). Adjusting simultaneously in multivariable Cox regression (N = 133 complete cases) for AJCC Stage (III-IV vs I-II), Histologic Grade (G3-G4 vs G1-G2 after repairing six Excel '3-Feb' records), and Resection Margin (R1/R2 vs R0), the risk score remained the single dominant independent predictor (Adjusted HR per SD = 2.270, 95% CI 1.749 to 2.946, $p = 7.12 \times 10^{-10}$, Figure 5F), outperforming Stage (HR = 0.759, $p = 0.331$), Grade (HR = 0.982, $p = 0.935$), and Margin (HR = 1.301, $p = 0.250$).
Evaluating the frozen Discovery risk weights across the n = 128 matched patients measured both on GPL6244 microarrays (GSE183795) and Illumina bulk RNA-seq (GSE224564) demonstrated exceptional cross-technology reproducibility: Pearson r = 0.9180 ($p = 1.87 \times 10^{-52}$), Spearman $\rho = 0.8980$ ($p = 9.21 \times 10^{-47}$), Lin's Concordance Correlation Coefficient $\rho_c = 0.9178$, Bland-Altman mean systematic bias +0.0205 (95% limits of agreement -0.7757 to +0.8166), median-split risk stratum agreement 90.6%, and Cohen's $\kappa = 0.8125$ (Figure 5D, Figure 7A).
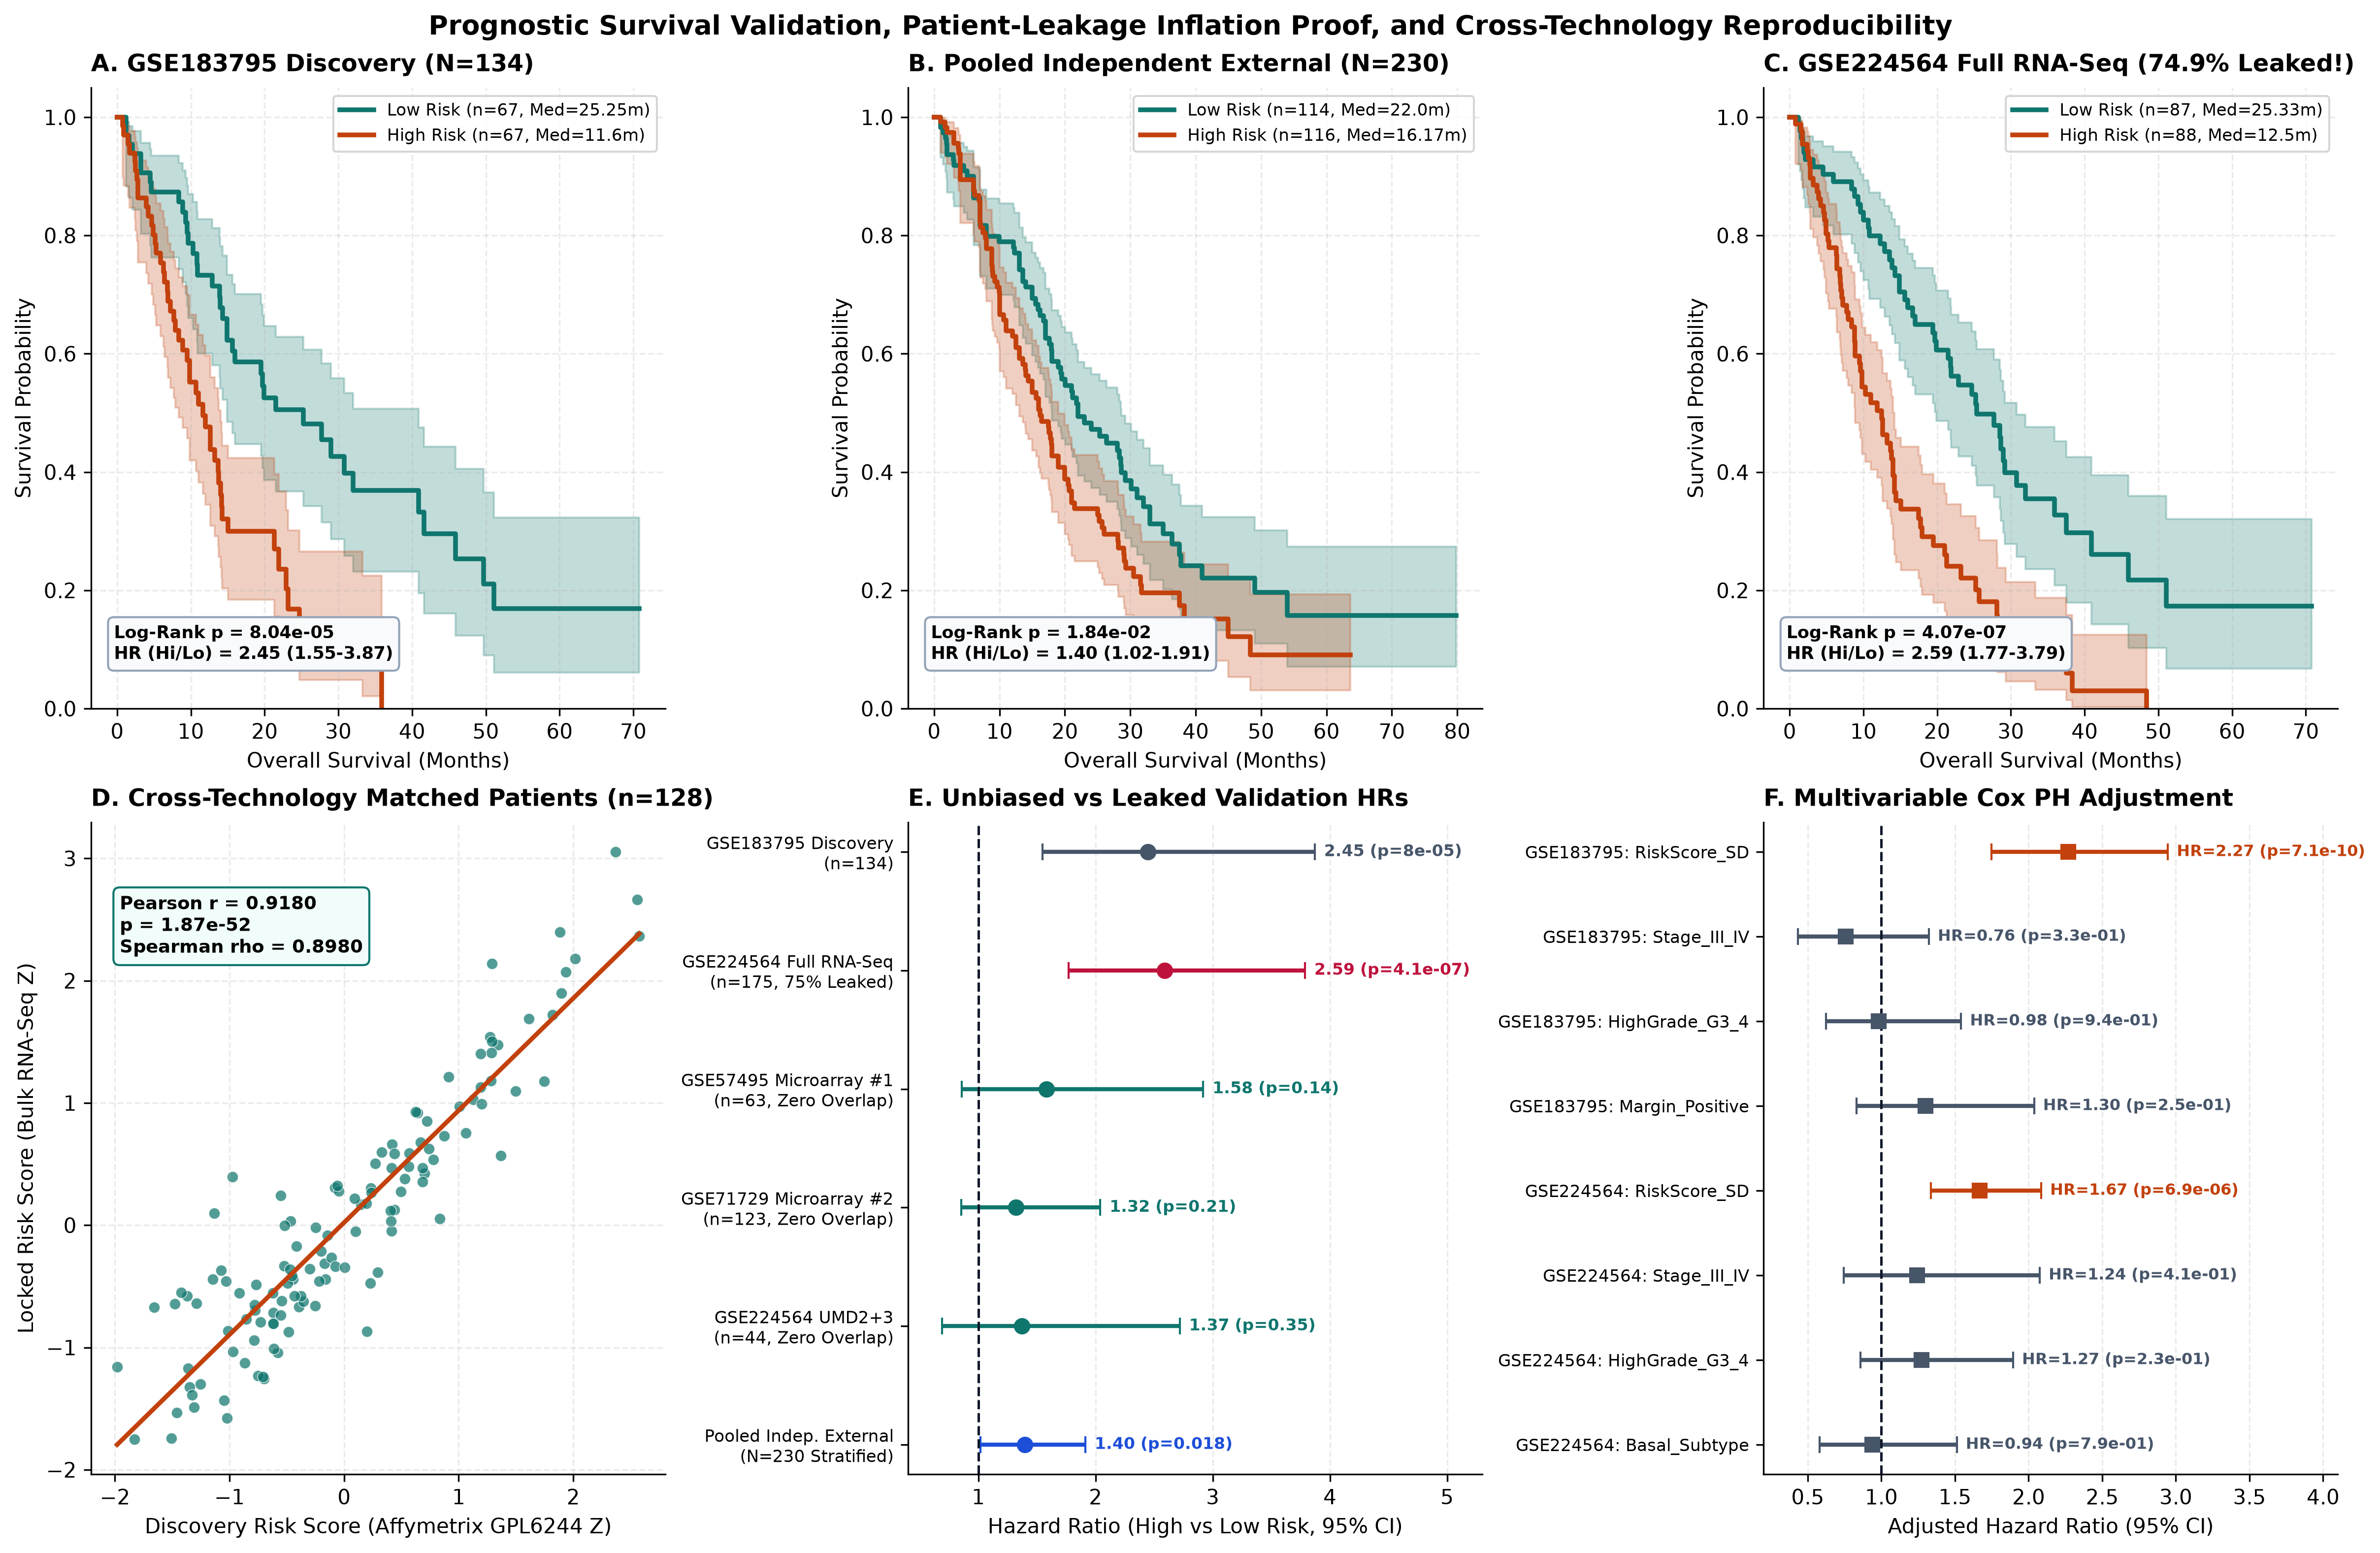
GSE183795, N = 134, HR = 2.448), strictly de-leaked Pooled External validation (N = 230, 161 deaths, Log-Rank $p = 0.0184$, Stratified HR = 1.396), and leakage-inflated GSE224564 Full (74.9% shared Discovery patients, apparent HR = 2.591). Panel D proves microarray-to-RNA-seq fidelity across 128 paired tumors (r = 0.9180), while Panels E and F display leakage-induced HR inflation and multivariable clinical adjustment.In sharp contrast, evaluating external generalization before versus after deduplication exposed severe optimistic bias driven by patient overlap (Table 4, Table 5, Figure 5C, Figure 8B). Treating un-audited GSE224564 Full ($N = 175$) as external validation produced an illusory HR = 2.591 (Log-Rank $p = 4.07 \times 10^{-7}$, C-index = 0.6520, Multivariable Adjusted HR = 1.669, $p = 6.90 \times 10^{-6}$). Within the 131 leaked tumors alone, continuous per-SD risk hazard measured 2.068 ($p = 7.94 \times 10^{-10}$), whereas within the 44 strictly clean UMD-2/3 RNA-seq patients, hazard settled at 1.370 (binary median split, $p = 0.351$; median OS 17.77 vs 25.33 months). Monte Carlo titration stepping from 0% (N = 44) to 20% (N = 55, mean HR = 1.585), 40% (N = 73, mean HR = 1.889), 60% (N = 110, mean HR = 2.237, mean $-\log_{10} p = 3.347$), and 74.9% overlap (N = 175, HR = 2.591, $-\log_{10} p = 6.390$, C = 0.6520) mapped an exact monotonic +85% inflation curve in binary hazard ratio solely attributable to sample leakage (Table 5, Figure 8B).
3.5 De-Leaked External Survival Generalization, Horizon ROC, and LOCO Sensitivity
When overlapping records were purged completely, all three independent external validation cohorts preserved adverse risk separation (GSE57495 $N = 63$: median OS 17.53 vs 28.33 months, HR = 1.582; GSE71729 $N = 123$: 15.00 vs 19.00 months, HR = 1.320; UMD-2/3 $N = 44$: 17.77 vs 25.33 months, HR = 1.370; Table 4), though each individual cohort lacked power alone (36 to 83 events). Combining all three strictly non-overlapping cohorts (N = 230, 161 deaths) in a cohort-stratified analysis confirmed statistically significant external survival stratification: median overall survival separated by 5.83 months (16.17 vs 22.00 months, Stratified Log-Rank $\chi^2 = 5.562$, $p = 0.0184$, Stratified Cox HR = 1.396, 95% CI 1.019 to 1.913, $p = 0.0378$; C-index = 0.5461, Figure 5B).
Time-dependent cumulative/dynamic ROC evaluation across follow-up horizons underscored realistic out-of-sample decay versus leaked inflation (Figure 7B): Discovery AUCs climbed from 0.7189 (12 months) to 0.8381 (24 months) and 0.9321 (36 months, Brier 0.0803), leaked GSE224564 Full remained artificially increased (0.7228 / 0.7068 / 0.6823), whereas strictly de-leaked Pooled External (N = 230) held 0.5956 at 12 months (214 evaluable), 0.5311 at 24 months, and 0.5288 at 36 months (Brier 0.2342 / 0.2732 / 0.1594). Importantly, Leave-One-Cohort-Out exclusion sensitivity verified that no single external site drove pooled hazard: dropping GSE57495 left N = 167 (HR = 1.334), dropping GSE71729 left N = 107 (HR = 1.485), and dropping UMD-2/3 left N = 186 (HR = 1.403, Table 4). Across clinical subgroups (Figure 7D), continuous risk remained consistently adverse across Stage I-II (N = 112, HR = 2.391, $p = 1.23 \times 10^{-9}$), Stage III-IV (N = 22, HR = 1.983, $p = 0.023$), negative R0 margins (N = 57, HR = 2.015, $p = 1.64 \times 10^{-4}$), R1/R2 margins (N = 77, HR = 2.394), low grade G1-G2 (HR = 1.816), high grade G3-G4 (HR = 2.858), GSE224564 SERPINB3-High (HR = 1.817, $p = 1.34 \times 10^{-5}$), and SERPINB3-Low (HR = 1.587, $p = 0.0031$).
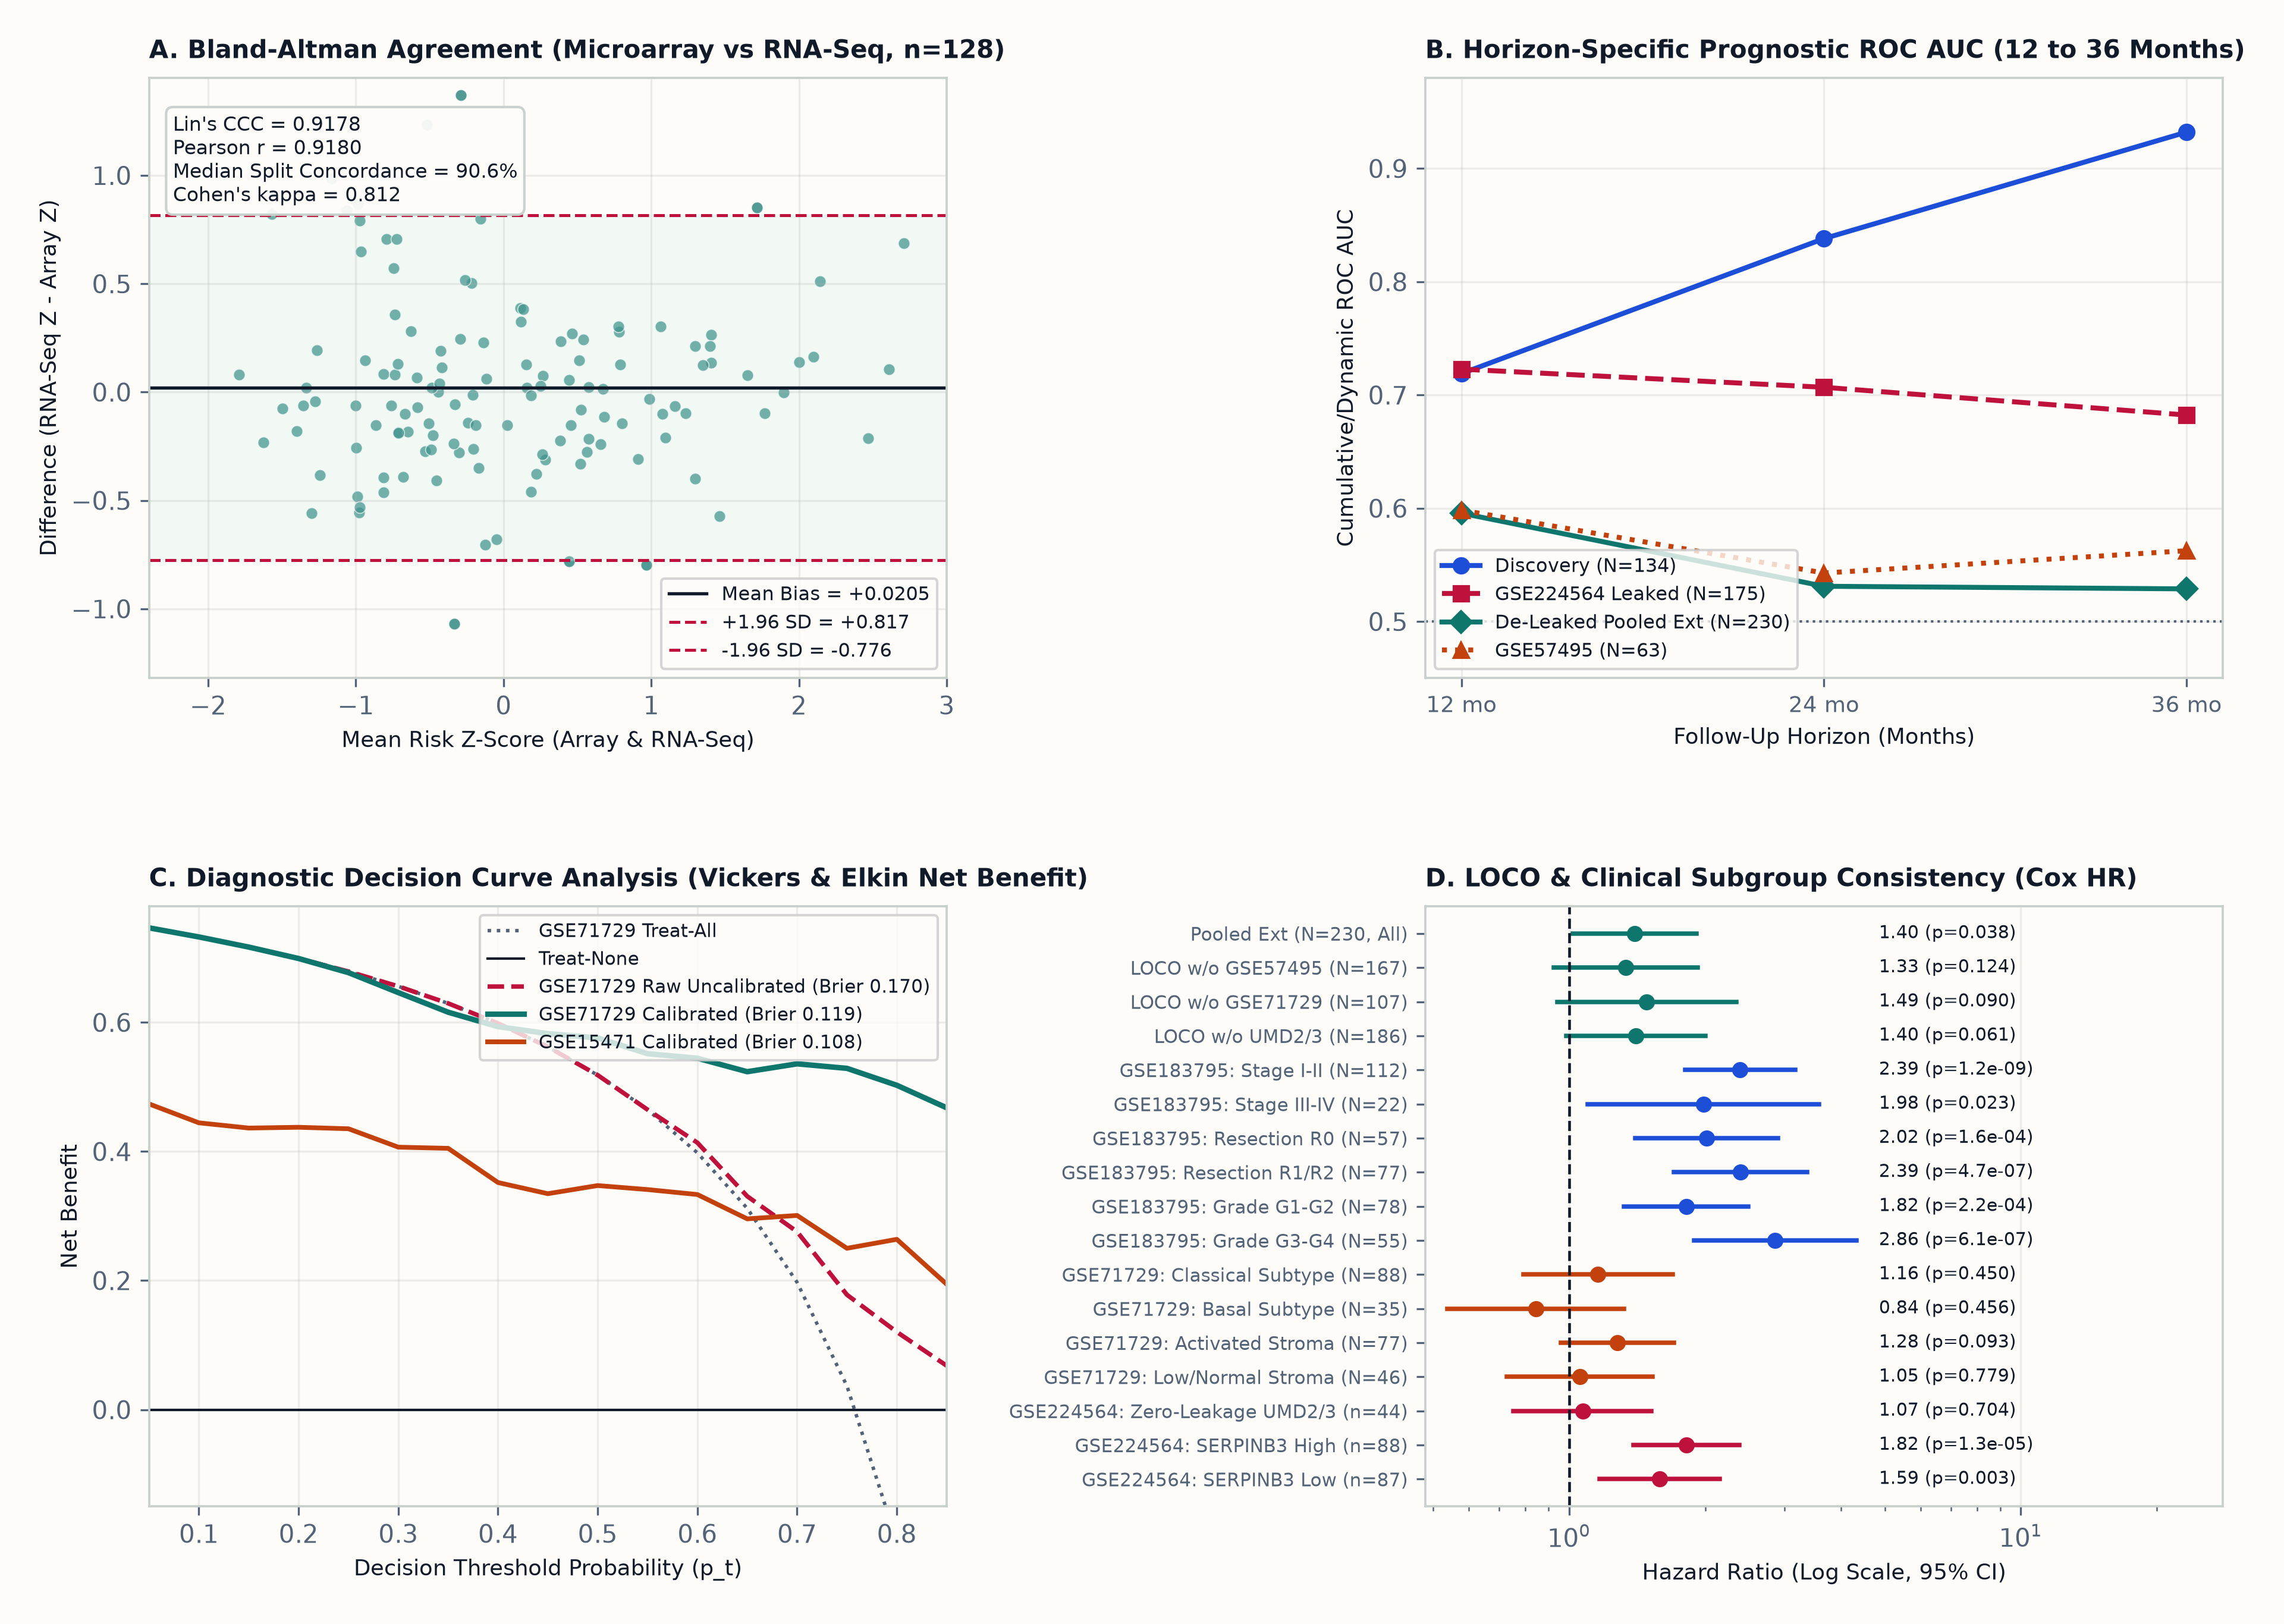
+0.0205), 95% limits of agreement (-0.776 to +0.817), Lin's CCC (0.9178), and Cohen's $\kappa$ (0.812) across n = 128 paired tumors. Panel B compares 12, 24, and 36-month cumulative/dynamic prognostic ROC AUCs. Panel C charts diagnostic Net Benefit, demonstrating superior clinical utility over Treat-All after platform intercept calibration. Panel D shows consistent hazard across LOCO drops and clinical strata.| Cohort / Sensitivity Subset | N (Deaths) | Median OS Hi vs Lo (mo) | Log-Rank p | Cox HR Hi vs Lo (95% CI) | Cox p | C-Index |
|---|---|---|---|---|---|---|
| GSE183795 (Discovery Tumors) | 134 (86) | 11.60 vs 25.25 | 8.04e-05 | 2.448 (1.548-3.870) | 1.28e-04 | 0.6786 |
| GSE57495 (External Microarray #1) | 63 (42) | 17.53 vs 28.33 | 0.1384 | 1.582 (0.858-2.918) | 0.1418 | 0.5386 |
| GSE71729 (External Microarray #2) | 123 (83) | 15.00 vs 19.00 | 0.2069 | 1.320 (0.855-2.040) | 0.2106 | 0.5594 |
| GSE224564_UMD2_3 (Zero-Leakage RNA-Seq Holdout) | 44 (36) | 17.77 vs 25.33 | 0.3511 | 1.370 (0.690-2.718) | 0.3682 | 0.5261 |
| GSE224564_Full (Full RNA-Seq Cohort, Audited) | 175 (118) | 12.50 vs 25.33 | 4.07e-07 | 2.591 (1.772-3.787) | 8.88e-07 | 0.6520 |
| Pooled Independent External (N=230 Stratified) | 230 (161) | 16.17 vs 22.00 | 0.0184 | 1.396 (1.019-1.913) | 0.0378 | 0.5461 |
| LOCO Sensitivity (Dropped GSE57495) | 167 (119) | Stratified | 0.1173 | 1.334 (0.924-1.926) | 0.1237 | Stratified Cox |
| LOCO Sensitivity (Dropped GSE71729) | 107 (78) | Stratified | 0.0844 | 1.485 (0.940-2.344) | 0.0901 | Stratified Cox |
| LOCO Sensitivity (Dropped UMD2/3 RNA-Seq) | 186 (125) | Stratified | 0.0586 | 1.403 (0.984-2.000) | 0.0610 | Stratified Cox |
GSE224564 Clean UMD-2/3 Base N = 44 Titrated with Overlapping Discovery Tumors).Discovery Overlap % (k / N) |
Monte Carlo Reps | Mean HR Hi vs Lo (5th-95th Pct) | Mean -log10(Log-Rank p) (5th-95th Pct) | Mean C-Index |
|---|---|---|---|---|
| 0.0% (0 / 44) | 1 | 1.370 (1.370-1.370) | 0.455 (0.455-0.455) | 0.5261 |
| 20.0% (11 / 55) | 250 | 1.585 (1.279-2.001) | 0.859 (0.366-1.502) | 0.5578 |
| 39.7% (29 / 73) | 250 | 1.889 (1.494-2.388) | 1.677 (0.842-2.727) | 0.5912 |
| 60.0% (66 / 110) | 250 | 2.237 (1.850-2.737) | 3.347 (2.076-4.910) | 0.6254 |
| 74.9% (131 / 175) | 1 | 2.591 (2.591-2.591) | 6.390 (6.390-6.390) | 0.6520 |
40% silent overlap, mean significance crosses standard $p = 0.05$ (-log10 p = 1.677 > 1.301), while 74.9% full leakage creates an apparent +85% binary hazard inflation (HR = 2.591 vs 1.370).3.6 Tumor-Intrinsic Basal-Like Plasticity and the SERPINB3-MYC Axis
Investigating the cellular basis of the locked survival score across external datasets demonstrated that high risk reflects intrinsic epithelial lineage plasticity rather than fibroblast stromal abundance (Figure 6A to 6B, Figure 8C). In bulk RNA-seq GSE224564, Moffitt Basal-like tumors (n = 48) scored far higher than Classical tumors (n = 95, mean risk Z +0.897 vs -0.219, one-sided Mann-Whitney $p = 8.00 \times 10^{-10}$, classification ROC AUC = 0.8096). Unclassified tumors (n = 32) scored lowest (-0.696), consistent with non-squamous biology. In addition, binary high SERPINB3 expression (Ohara et al. [13], n = 88 vs 87 low) strongly increased the prognostic risk Z-score (+0.425 vs -0.430, Cohen's d = +0.941, ROC AUC = 0.7601, $p = 2.85 \times 10^{-9}$), with 87.5% of Basal tumors classified SERPINB3-High versus 47.4% Classical and 3.1% Unclassified (Figure 8C). This Basal discrimination replicated independently in Agilent two-channel GSE71729 (Basal n = 89 mean +0.897 vs Classical n = 132 -0.239, $p = 1.91 \times 10^{-17}$, ROC AUC = 0.8341), yet when stratified by Moffitt stromal subtype, Activated Stroma (n = 99, +0.184) and Low/Normal Stroma (n = 122, +0.246) showed zero elevation ($p = 0.234$), establishing epithelial-cell specificity.
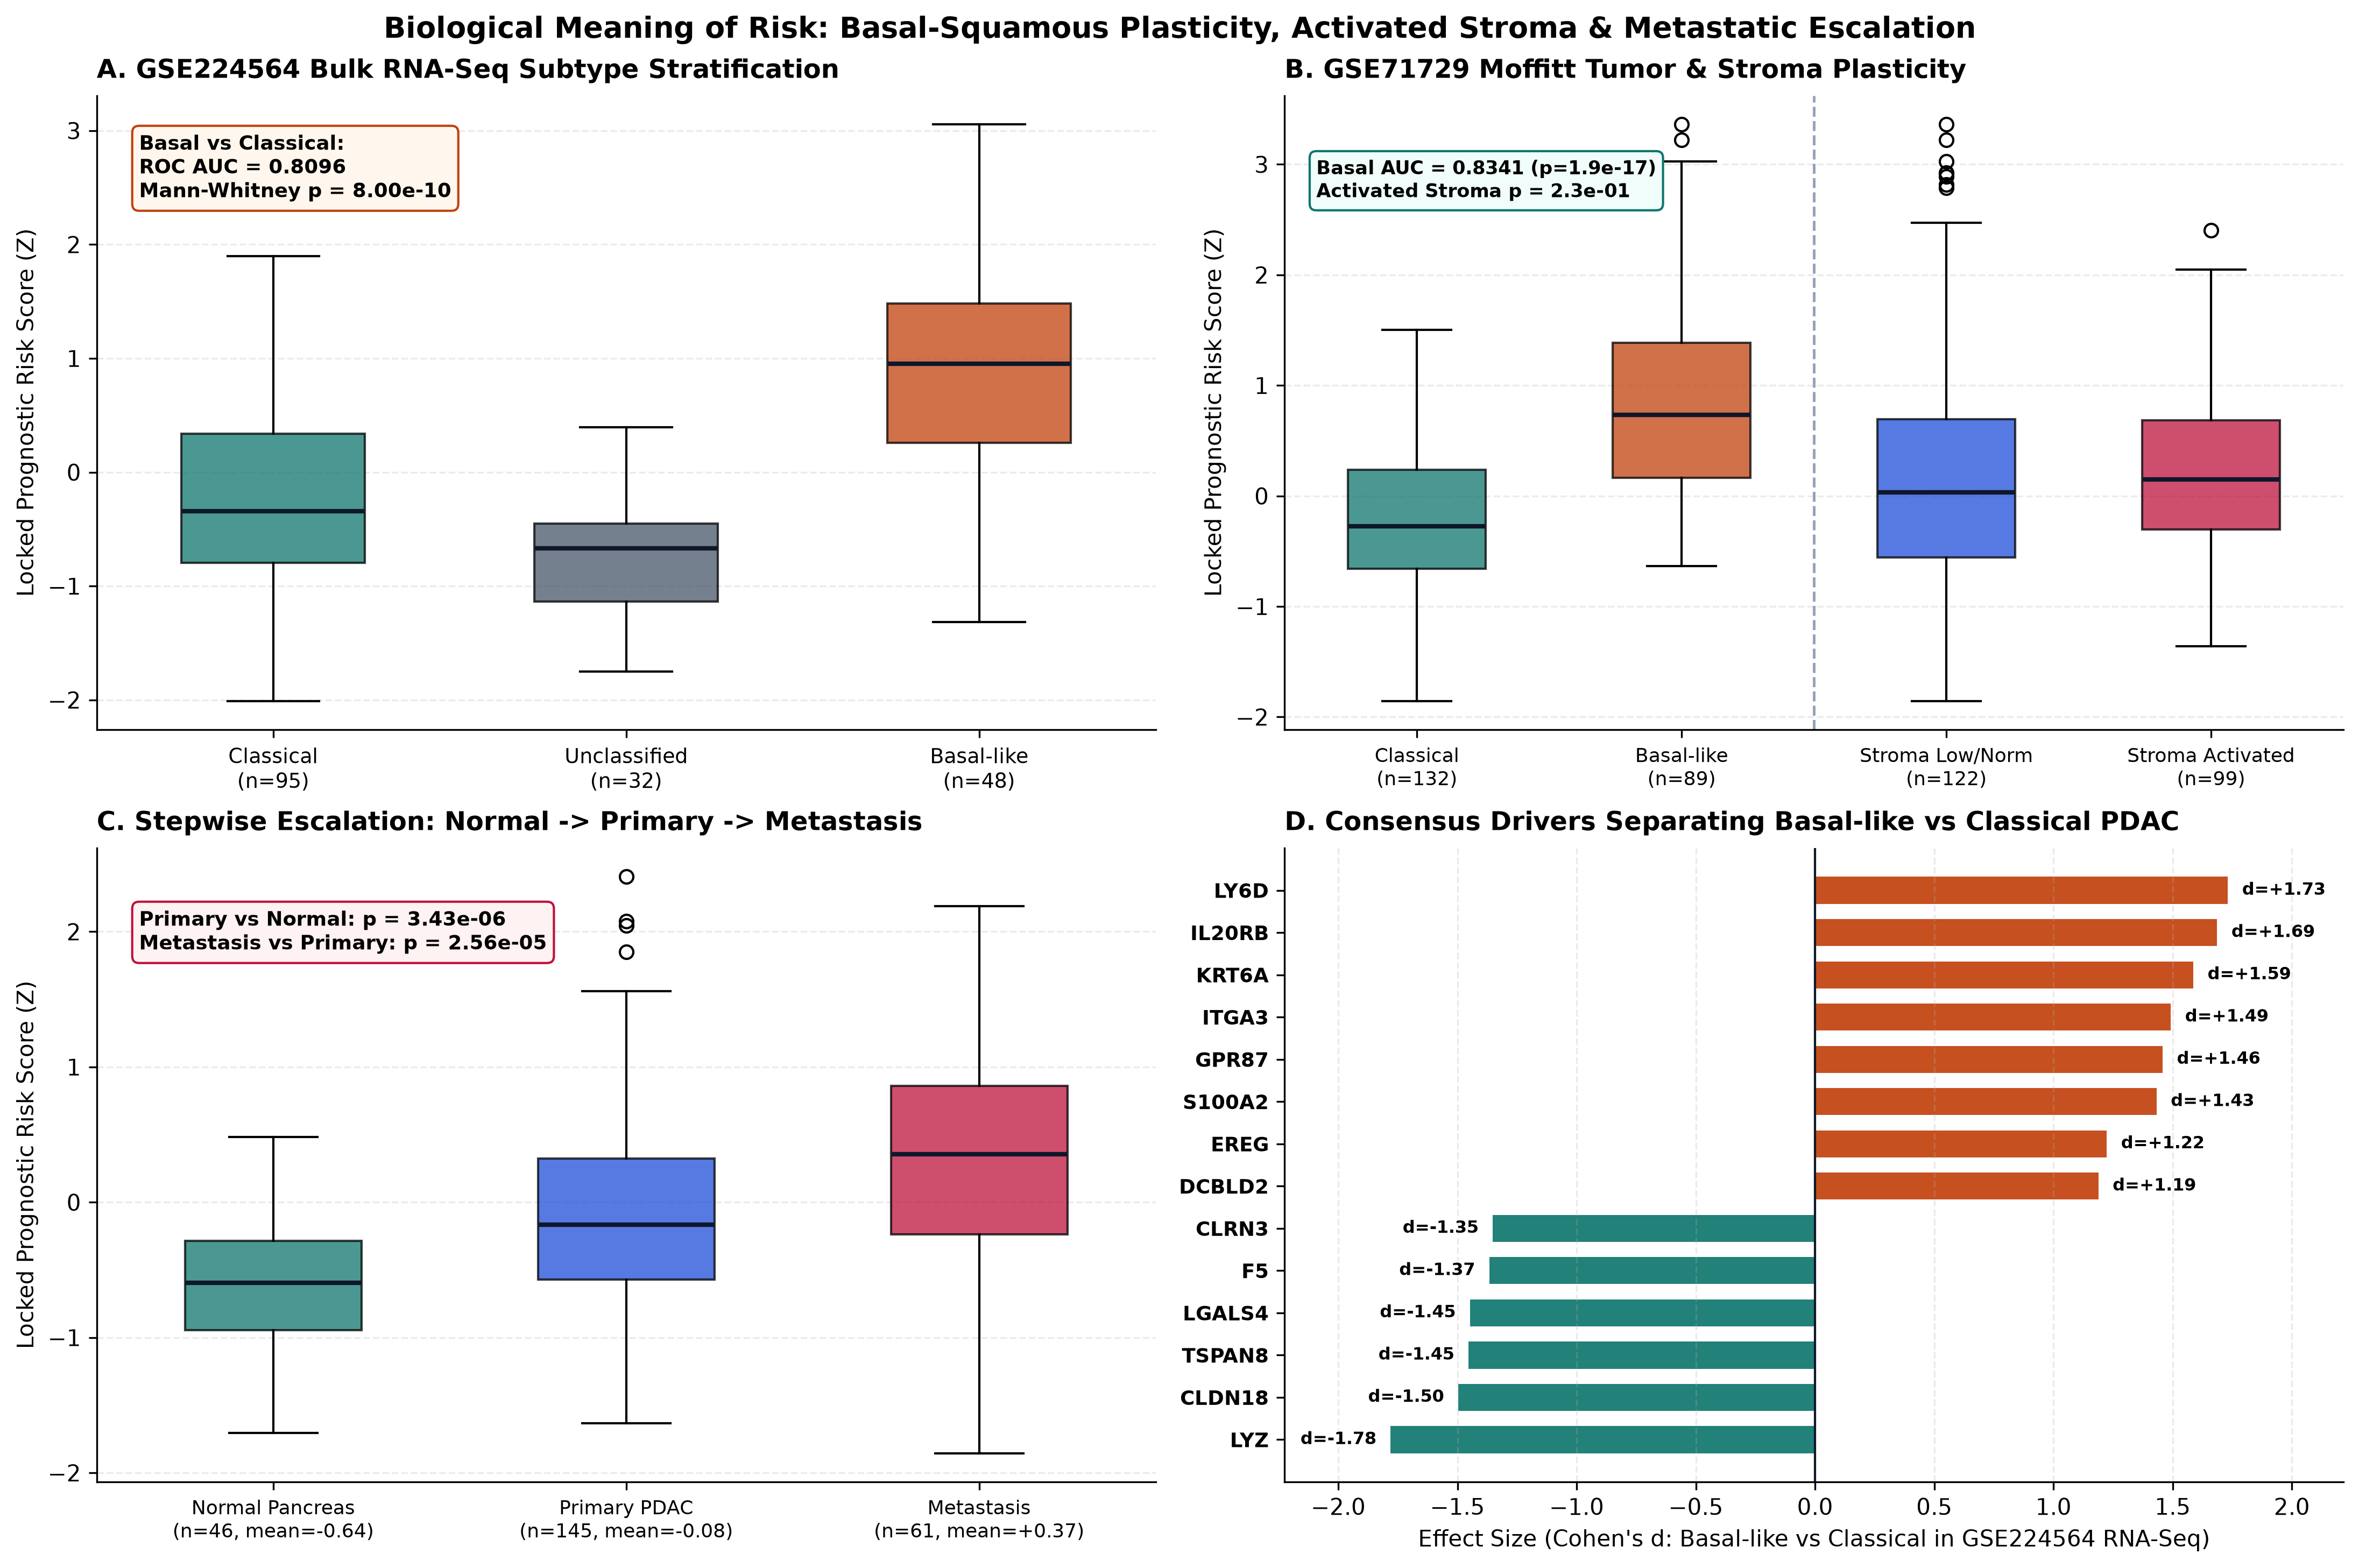
GSE224564 RNA-seq (AUC = 0.8096) and GSE71729 Agilent (AUC = 0.8341) with zero activated-stroma bias ($p = 0.234$). Panel C shows stepwise risk accumulation from Normal Pancreas to Primary PDAC and Metastasis; Panel D ranks top consensus Basal drivers (LY6D, IL20RB, KRT6A, ITGA3) against Classical anchors (LYZ, CLDN18, TSPAN8).3.7 Disease Escalation and Site-Matched Organ Decontamination in Metastasis
Across the anatomical trajectory of PDAC in GSE71729, locked risk increased monotonically from Normal Pancreas (n = 46, mean Z -0.641) to Primary PDAC (n = 145, -0.076, two-sided MWU $p = 6.85 \times 10^{-6}$) and Distant Metastasis (n = 61, +0.368, two-sided MWU $p = 5.12 \times 10^{-5}$), peaking in pure epithelial PDAC Cell Lines (n = 17, mean +2.490, median +2.785; Table 6, Figure 8A). Because distant biopsies inevitably contain parenchymal transcripts from host organs such as liver or lung, we performed strict site-matched decontamination controls against uninvolved normal tissues sampled from the exact same target organs in GSE71729 (Table 6, Figure 8A).
Crucially, Liver_Metastasis (n = 25, mean +0.322, median +0.515) separated sharply from Liver_Normal parenchyma (n = 27, mean -1.052, median -1.271) with massive effect size (Cohen's d = +1.787, ROC AUC = 0.8844, Mann-Whitney $p = 2.10 \times 10^{-6}$), completely excluding hepatocyte background noise as the driver of metastatic score elevation. Overall Distant Metastasis (n = 61, +0.368) likewise strongly exceeded pooled Non-Pancreas Normal organs (n = 88, -0.275, d = +0.738, ROC AUC = 0.6913, $p = 7.41 \times 10^{-5}$). Equally informative, benign LymphNode_Normal (n = 10, mean +0.746) carried increased baseline proliferative transcripts comparable to LymphNode_Metastasis (n = 9, +0.566, $p = 0.540$), and small sample size limited statistical power in Lung_Metastasis (n = 8, -0.171) vs Lung_Normal (n = 19, -0.348, d = +0.210, $p = 0.549$). Intersecting our 565 four-platform consensus PDAC genes with GSE224564 subtype comparisons isolated LY6D ($d = +1.73$), IL20RB ($d = +1.69$), KRT6A ($d = +1.59$), ITGA3 ($d = +1.49$, FDR = $1.73 \times 10^{-9}$), GPR87 ($d = +1.46$), and S100A2 ($d = +1.43$) as dominant Basal progression effectors opposite Classical mucosal guardians LYZ ($d = -1.78$) and CLDN18 ($d = -1.50$).
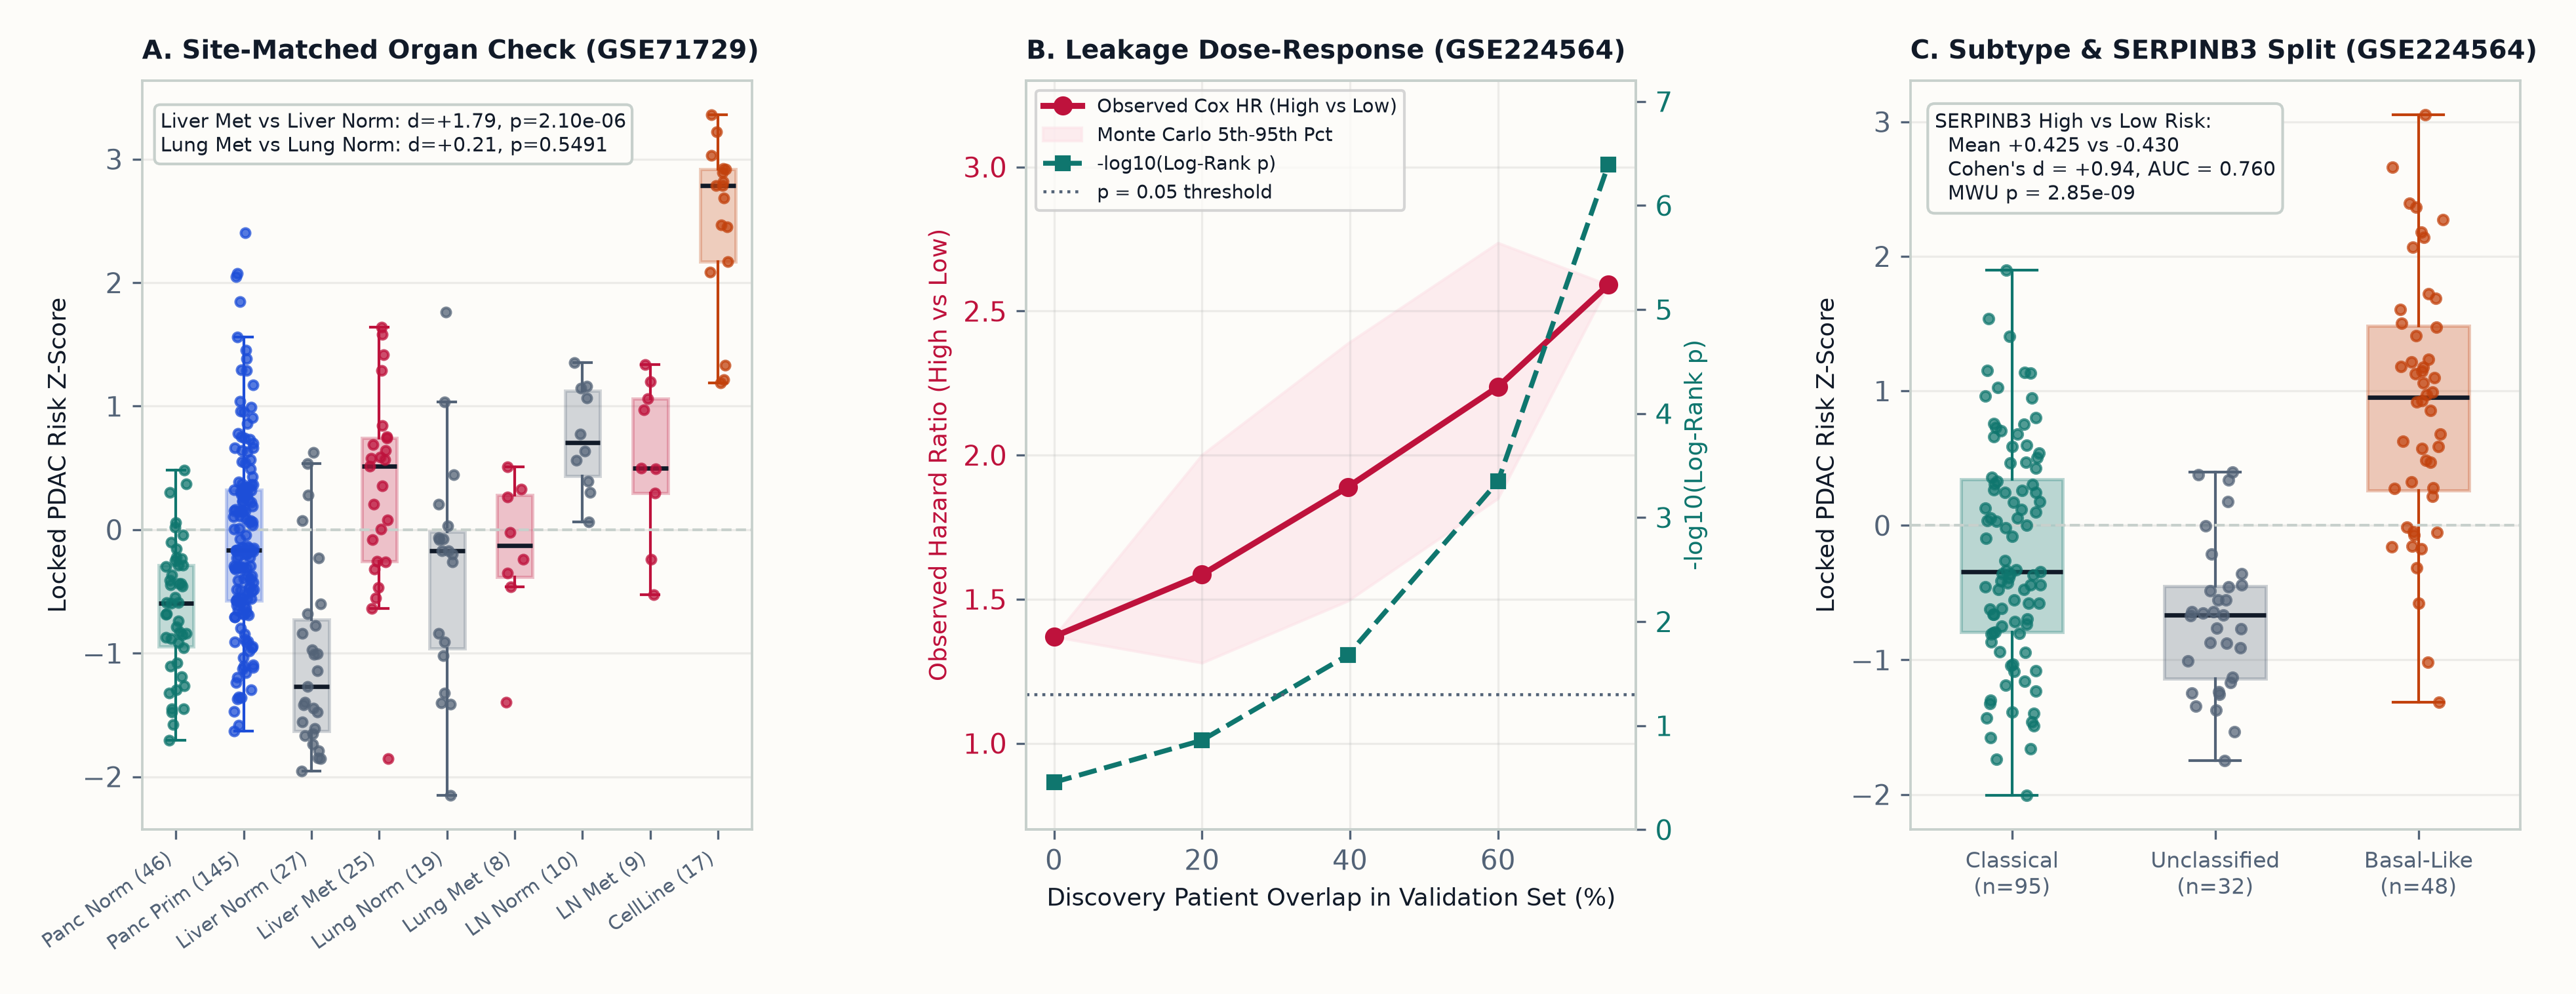
SERPINB3 Subtype Stratification. Panel A contrasts organ-specific metastases against host normal parenchyma in GSE71729 (Liver_Metastasis vs Liver_Normal $d = +1.79, p = 2.10 \times 10^{-6}$; benign LymphNode_Normal shows high immune-proliferation baseline; pure CellLine peaks at +2.49). Panel B plots progressive Cox HR and $-\log_{10} p$ inflation across 250 Monte Carlo draws per overlap level in GSE224564. Panel C separates Classical, Unclassified, and Basal-like RNA-seq tumors alongside SERPINB3 stratification ($d = +0.941$).GSE71729 Tissues (N = 357 Profiles Analyzed Across Primary, Normal Host Organs, and Distant Metastases).| Site-Matched / Progression Contrast | n1 vs n2 | Mean Risk Z (n1 vs n2) | Cohen's d | ROC AUC | Two-Sided MWU p |
|---|---|---|---|---|---|
| Liver: Metastasis vs Site-Matched Normal | 25 vs 27 | +0.322 vs -1.052 | +1.787 | 0.8844 | 2.10e-06 |
| Lung: Metastasis vs Site-Matched Normal | 8 vs 19 | -0.171 vs -0.348 | +0.210 | 0.5789 | 0.5491 |
| Lymph Node: Metastasis vs Site-Matched Normal | 9 vs 10 | +0.566 vs +0.746 | -0.333 | 0.4111 | 0.5403 |
| Pancreas: Primary PDAC vs Pancreas Normal | 145 vs 46 | -0.076 vs -0.641 | +0.789 | 0.7204 | 6.85e-06 |
| Distant Metastasis (All) vs Primary PDAC | 61 vs 145 | +0.368 vs -0.076 | +0.584 | 0.6789 | 5.12e-05 |
| Distant Metastasis (All) vs All Non-Pancreas Normals | 61 vs 88 | +0.368 vs -0.275 | +0.738 | 0.6913 | 7.41e-05 |
Liver_Normal (-1.052) proves hepatic background dilutes rather than inflates Liver_Metastasis (+0.322), whereas high benign LymphNode_Normal reflects germinal-center leukocyte mitosis (CDKN3, TPX2, PRC1 background).